Slovene vs Arab Unemployment Among Ages 55 to 59 years

COMPARE

Slovene
Race
Ancestry
AfghanAfricanAlaska NativeAlaskan AthabascanAlbanianAleutAlsatianAmericanApacheArapahoArgentineanArmenianAssyrian/Chaldean/SyriacAustralianAustrianBahamianBangladeshiBarbadianBasqueBelgianBelizeanBermudanBhutaneseBlackfeetBolivianBrazilianBritishBritish West IndianBulgarianBurmeseCajunCambodianCanadianCape VerdeanCarpatho RusynCelticCentral AmericanCentral American IndianCherokeeCheyenneChickasawChileanChineseChippewaChoctawColombianColvilleComancheCosta RicanCreeCreekCroatianCrowCubanCypriotCzechCzechoslovakianDanishDelawareDominicanDutchDutch West IndianEastern EuropeanEcuadorianEgyptianEnglishEstonianEthiopianEuropeanFijianFilipinoFinnishFrenchFrench American IndianFrench CanadianGermanGerman RussianGhanaianGreekGuamanian/ChamorroGuatemalanGuyaneseHaitianHmongHonduranHopiHoumaHungarianIcelanderIndian (Asian)IndonesianInupiatIranianIraqiIrishIroquoisIsraeliItalianJamaicanJapaneseJordanianKenyanKiowaKoreanLaotianLatvianLebaneseLiberianLithuanianLumbeeLuxembourgerMacedonianMalaysianMalteseMarshalleseMenomineeMexicanMexican American IndianMongolianMoroccanNative HawaiianNavajoNepaleseNew ZealanderNicaraguanNigerianNorthern EuropeanNorwegianOkinawanOsageOttawaPaiutePakistaniPalestinianPanamanianParaguayanPennsylvania GermanPeruvianPimaPolishPortuguesePotawatomiPuebloPuerto RicanPuget Sound SalishRomanianRussianSalvadoranSamoanScandinavianScotch-IrishScottishSeminoleSenegaleseSerbianShoshoneSierra LeoneanSiouxSlavicSlovakSloveneSomaliSouth AfricanSouth AmericanSouth American IndianSoviet UnionSpaniardSpanishSpanish AmericanSpanish American IndianSri LankanSubsaharan AfricanSudaneseSwedishSwissSyrianTaiwaneseThaiTlingit-HaidaTohono O'OdhamTonganTrinidadian and TobagonianTsimshianTurkishU.S. Virgin IslanderUgandanUkrainianUruguayanUteVenezuelanVietnameseWelshWest IndianYakamaYaquiYugoslavianYumanYup'ikZimbabwean
Immigration
NonimmigrantsImmigrantsAfghanistanAfricaAlbaniaArgentinaArmeniaAsiaAustraliaAustriaBahamasBangladeshBarbadosBelarusBelgiumBelizeBoliviaBosnia and HerzegovinaBrazilBulgariaBurma/MyanmarCabo VerdeCambodiaCameroonCanadaCaribbeanCentral AmericaChileChinaColombiaCongoCosta RicaCroatiaCubaCzechoslovakiaDenmarkDominicaDominican RepublicEastern AfricaEastern AsiaEastern EuropeEcuadorEgyptEl SalvadorEnglandEritreaEthiopiaEuropeFijiFranceGermanyGhanaGreeceGrenadaGuatemalaGuyanaHaitiHondurasHong KongHungaryIndiaIndonesiaIranIraqIrelandIsraelItalyJamaicaJapanJordanKazakhstanKenyaKoreaKuwaitLaosLatin AmericaLatviaLebanonLiberiaLithuaniaMalaysiaMexicoMicronesiaMiddle AfricaMoldovaMoroccoNepalNetherlandsNicaraguaNigeriaNorth AmericaNorth MacedoniaNorthern AfricaNorthern EuropeNorwayOceaniaPakistanPanamaPeruPhilippinesPolandPortugalRomaniaRussiaSaudi ArabiaScotlandSenegalSerbiaSierra LeoneSingaporeSomaliaSouth AfricaSouth AmericaSouth Central AsiaSouth Eastern AsiaSouthern EuropeSpainSri LankaSt. Vincent and the GrenadinesSudanSwedenSwitzerlandSyriaTaiwanThailandTrinidad and TobagoTurkeyUgandaUkraineUruguayUzbekistanVenezuelaVietnamWest IndiesWestern AfricaWestern AsiaWestern EuropeYemenZaireZimbabweAzores
Arab
Race
Ancestry
AfghanAfricanAlaska NativeAlaskan AthabascanAlbanianAleutAlsatianAmericanApacheArabArapahoArgentineanArmenianAssyrian/Chaldean/SyriacAustralianAustrianBahamianBangladeshiBarbadianBasqueBelgianBelizeanBermudanBhutaneseBlackfeetBolivianBrazilianBritishBritish West IndianBulgarianBurmeseCajunCambodianCanadianCape VerdeanCarpatho RusynCelticCentral AmericanCentral American IndianCherokeeCheyenneChickasawChileanChineseChippewaChoctawColombianColvilleComancheCosta RicanCreeCreekCroatianCrowCubanCypriotCzechCzechoslovakianDanishDelawareDominicanDutchDutch West IndianEastern EuropeanEcuadorianEgyptianEnglishEstonianEthiopianEuropeanFijianFilipinoFinnishFrenchFrench American IndianFrench CanadianGermanGerman RussianGhanaianGreekGuamanian/ChamorroGuatemalanGuyaneseHaitianHmongHonduranHopiHoumaHungarianIcelanderIndian (Asian)IndonesianInupiatIranianIraqiIrishIroquoisIsraeliItalianJamaicanJapaneseJordanianKenyanKiowaKoreanLaotianLatvianLebaneseLiberianLithuanianLumbeeLuxembourgerMacedonianMalaysianMalteseMarshalleseMenomineeMexicanMexican American IndianMongolianMoroccanNative HawaiianNavajoNepaleseNew ZealanderNicaraguanNigerianNorthern EuropeanNorwegianOkinawanOsageOttawaPaiutePakistaniPalestinianPanamanianParaguayanPennsylvania GermanPeruvianPimaPolishPortuguesePotawatomiPuebloPuerto RicanPuget Sound SalishRomanianRussianSalvadoranSamoanScandinavianScotch-IrishScottishSeminoleSenegaleseSerbianShoshoneSierra LeoneanSiouxSlavicSlovakSomaliSouth AfricanSouth AmericanSouth American IndianSoviet UnionSpaniardSpanishSpanish AmericanSpanish American IndianSri LankanSubsaharan AfricanSudaneseSwedishSwissSyrianTaiwaneseThaiTlingit-HaidaTohono O'OdhamTonganTrinidadian and TobagonianTsimshianTurkishU.S. Virgin IslanderUgandanUkrainianUruguayanUteVenezuelanVietnameseWelshWest IndianYakamaYaquiYugoslavianYumanYup'ikZimbabwean
Immigration
NonimmigrantsImmigrantsAfghanistanAfricaAlbaniaArgentinaArmeniaAsiaAustraliaAustriaBahamasBangladeshBarbadosBelarusBelgiumBelizeBoliviaBosnia and HerzegovinaBrazilBulgariaBurma/MyanmarCabo VerdeCambodiaCameroonCanadaCaribbeanCentral AmericaChileChinaColombiaCongoCosta RicaCroatiaCubaCzechoslovakiaDenmarkDominicaDominican RepublicEastern AfricaEastern AsiaEastern EuropeEcuadorEgyptEl SalvadorEnglandEritreaEthiopiaEuropeFijiFranceGermanyGhanaGreeceGrenadaGuatemalaGuyanaHaitiHondurasHong KongHungaryIndiaIndonesiaIranIraqIrelandIsraelItalyJamaicaJapanJordanKazakhstanKenyaKoreaKuwaitLaosLatin AmericaLatviaLebanonLiberiaLithuaniaMalaysiaMexicoMicronesiaMiddle AfricaMoldovaMoroccoNepalNetherlandsNicaraguaNigeriaNorth AmericaNorth MacedoniaNorthern AfricaNorthern EuropeNorwayOceaniaPakistanPanamaPeruPhilippinesPolandPortugalRomaniaRussiaSaudi ArabiaScotlandSenegalSerbiaSierra LeoneSingaporeSomaliaSouth AfricaSouth AmericaSouth Central AsiaSouth Eastern AsiaSouthern EuropeSpainSri LankaSt. Vincent and the GrenadinesSudanSwedenSwitzerlandSyriaTaiwanThailandTrinidad and TobagoTurkeyUgandaUkraineUruguayUzbekistanVenezuelaVietnamWest IndiesWestern AfricaWestern AsiaWestern EuropeYemenZaireZimbabweAzores
Unemployment Among Ages 55 to 59 years
Income
Poverty
Unemployment
Labor Participation
Family Structure
Vehicle Availability
Education Level
Disability

Unemployment Among Ages 55 to 59 years Comparison

Slovenes

Arabs

Exceptional
Average
4.6%
UNEMPLOYMENT AMONG AGES 55 TO 59 YEARS
99.3/ 100
METRIC RATING
62nd/ 347
METRIC RANK
4.8%
UNEMPLOYMENT AMONG AGES 55 TO 59 YEARS
44.7/ 100
METRIC RATING
178th/ 347
METRIC RANK

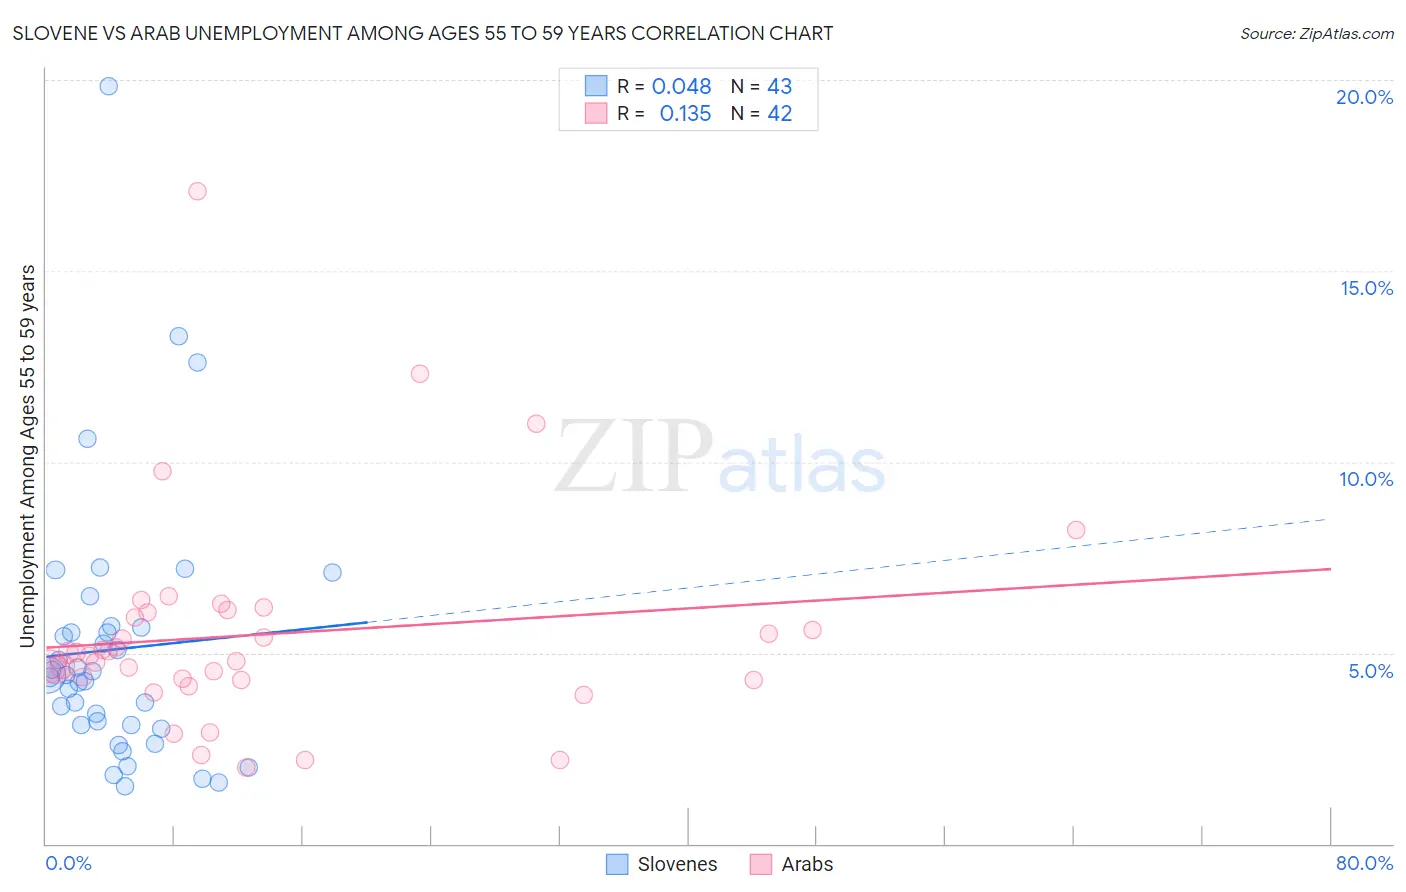
Slovene vs Arab Unemployment Among Ages 55 to 59 years Correlation Chart

The statistical analysis conducted on geographies consisting of 247,033,366 people shows no correlation between the proportion of Slovenes and unemployment rate among population between the ages 55 and 59 in the United States with a correlation coefficient (R) of 0.048 and weighted average of 4.6%. Similarly, the statistical analysis conducted on geographies consisting of 441,814,241 people shows a poor positive correlation between the proportion of Arabs and unemployment rate among population between the ages 55 and 59 in the United States with a correlation coefficient (R) of 0.135 and weighted average of 4.8%, a difference of 5.6%.
Slovene vs Arab Unemployment Among Ages 55 to 59 years

Unemployment Among Ages 55 to 59 years Correlation Summary

MeasurementSloveneArab
Minimum1.5%2.0%
Maximum19.8%17.1%
Range18.3%15.1%
Mean5.1%5.5%
Median4.4%5.0%
Interquartile 25% (IQ1)3.1%4.3%
Interquartile 75% (IQ3)5.7%6.1%
Interquartile Range (IQR)2.5%1.8%
Standard Deviation (Sample)3.5%2.8%
Standard Deviation (Population)3.4%2.7%

Similar Demographics by Unemployment Among Ages 55 to 59 years

Demographics Similar to Slovenes by Unemployment Among Ages 55 to 59 years

In terms of unemployment among ages 55 to 59 years, the demographic groups most similar to Slovenes are Immigrants from South Central Asia (4.6%, a difference of 0.080%), Immigrants from Argentina (4.6%, a difference of 0.25%), Argentinean (4.6%, a difference of 0.26%), Sudanese (4.6%, a difference of 0.27%), and Dutch (4.6%, a difference of 0.34%).
DemographicsRating | RankUnemployment Among Ages 55 to 59 years
Immigrants | Nepal
99.6
/100
|
#55
Exceptional
4.5%
Welsh
99.6
/100
|
#56
Exceptional
4.5%
Northern Europeans
99.6
/100
|
#57
Exceptional
4.5%
Okinawans
99.6
/100
|
#58
Exceptional
4.5%
Immigrants | Uganda
99.5
/100
|
#59
Exceptional
4.6%
Dutch
99.5
/100
|
#60
Exceptional
4.6%
Immigrants | Argentina
99.5
/100
|
#61
Exceptional
4.6%
Slovenes
99.3
/100
|
#62
Exceptional
4.6%
Immigrants | South Central Asia
99.3
/100
|
#63
Exceptional
4.6%
Argentineans
99.1
/100
|
#64
Exceptional
4.6%
Sudanese
99.1
/100
|
#65
Exceptional
4.6%
Mongolians
99.0
/100
|
#66
Exceptional
4.6%
Ugandans
99.0
/100
|
#67
Exceptional
4.6%
Immigrants | Micronesia
99.0
/100
|
#68
Exceptional
4.6%
Czechoslovakians
99.0
/100
|
#69
Exceptional
4.6%

Demographics Similar to Arabs by Unemployment Among Ages 55 to 59 years

In terms of unemployment among ages 55 to 59 years, the demographic groups most similar to Arabs are Hungarian (4.8%, a difference of 0.020%), South American (4.8%, a difference of 0.030%), Immigrants from Sri Lanka (4.8%, a difference of 0.090%), Samoan (4.8%, a difference of 0.10%), and Australian (4.8%, a difference of 0.16%).
DemographicsRating | RankUnemployment Among Ages 55 to 59 years
Japanese
54.5
/100
|
#171
Average
4.8%
Nicaraguans
54.0
/100
|
#172
Average
4.8%
Immigrants | Eastern Europe
52.2
/100
|
#173
Average
4.8%
Immigrants | Croatia
50.0
/100
|
#174
Average
4.8%
Australians
48.6
/100
|
#175
Average
4.8%
Samoans
47.1
/100
|
#176
Average
4.8%
Immigrants | Sri Lanka
46.8
/100
|
#177
Average
4.8%
Arabs
44.7
/100
|
#178
Average
4.8%
Hungarians
44.3
/100
|
#179
Average
4.8%
South Americans
44.0
/100
|
#180
Average
4.8%
Immigrants | Hungary
40.4
/100
|
#181
Average
4.8%
Immigrants | Europe
40.4
/100
|
#182
Average
4.8%
Immigrants | Peru
38.6
/100
|
#183
Fair
4.8%
Immigrants | Czechoslovakia
38.0
/100
|
#184
Fair
4.8%
Peruvians
37.0
/100
|
#185
Fair
4.8%