Slovak vs Lithuanian Unemployment Among Ages 45 to 54 years
COMPARE
Slovak
Lithuanian
Unemployment Among Ages 45 to 54 years
Unemployment Among Ages 45 to 54 years Comparison
Slovaks
Lithuanians
4.3%
UNEMPLOYMENT AMONG AGES 45 TO 54 YEARS
98.8/ 100
METRIC RATING
68th/ 347
METRIC RANK
4.3%
UNEMPLOYMENT AMONG AGES 45 TO 54 YEARS
99.1/ 100
METRIC RATING
62nd/ 347
METRIC RANK
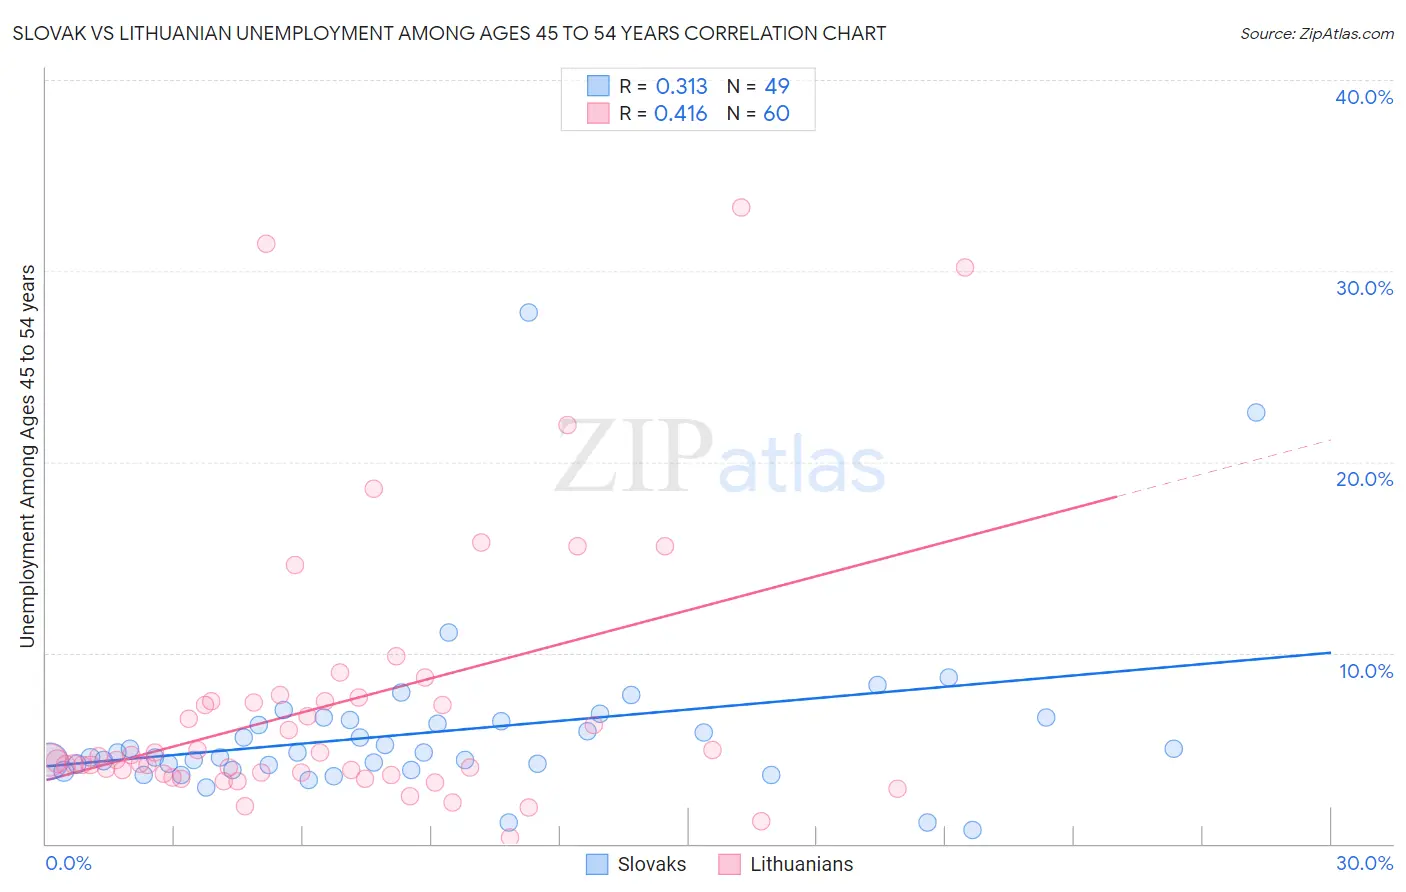
Slovak vs Lithuanian Unemployment Among Ages 45 to 54 years Correlation Chart
The statistical analysis conducted on geographies consisting of 384,514,686 people shows a mild positive correlation between the proportion of Slovaks and unemployment rate among population between the ages 45 and 54 in the United States with a correlation coefficient (R) of 0.313 and weighted average of 4.3%. Similarly, the statistical analysis conducted on geographies consisting of 407,579,689 people shows a moderate positive correlation between the proportion of Lithuanians and unemployment rate among population between the ages 45 and 54 in the United States with a correlation coefficient (R) of 0.416 and weighted average of 4.3%, a difference of 0.35%.
Unemployment Among Ages 45 to 54 years Correlation Summary
| Measurement | Slovak | Lithuanian |
| Minimum | 0.70% | 0.30% |
| Maximum | 27.8% | 33.3% |
| Range | 27.1% | 33.0% |
| Mean | 5.8% | 7.3% |
| Median | 4.8% | 4.4% |
| Interquartile 25% (IQ1) | 4.0% | 3.7% |
| Interquartile 75% (IQ3) | 6.5% | 7.5% |
| Interquartile Range (IQR) | 2.5% | 3.8% |
| Standard Deviation (Sample) | 4.5% | 7.1% |
| Standard Deviation (Population) | 4.4% | 7.0% |
Demographics Similar to Slovaks and Lithuanians by Unemployment Among Ages 45 to 54 years
In terms of unemployment among ages 45 to 54 years, the demographic groups most similar to Slovaks are Immigrants from Nepal (4.3%, a difference of 0.070%), Turkish (4.3%, a difference of 0.10%), Immigrants from Sudan (4.3%, a difference of 0.13%), Immigrants from Japan (4.3%, a difference of 0.13%), and Austrian (4.3%, a difference of 0.17%). Similarly, the demographic groups most similar to Lithuanians are Pennsylvania German (4.3%, a difference of 0.090%), Immigrants from Korea (4.3%, a difference of 0.14%), Immigrants from Pakistan (4.3%, a difference of 0.14%), Okinawan (4.3%, a difference of 0.17%), and Austrian (4.3%, a difference of 0.19%).
| Demographics | Rating | Rank | Unemployment Among Ages 45 to 54 years |
| Latvians | 99.4 /100 | #55 | Exceptional 4.2% |
| Immigrants | Jordan | 99.3 /100 | #56 | Exceptional 4.3% |
| Immigrants | Sri Lanka | 99.3 /100 | #57 | Exceptional 4.3% |
| Greeks | 99.3 /100 | #58 | Exceptional 4.3% |
| Okinawans | 99.2 /100 | #59 | Exceptional 4.3% |
| Immigrants | Korea | 99.2 /100 | #60 | Exceptional 4.3% |
| Immigrants | Pakistan | 99.2 /100 | #61 | Exceptional 4.3% |
| Lithuanians | 99.1 /100 | #62 | Exceptional 4.3% |
| Pennsylvania Germans | 99.1 /100 | #63 | Exceptional 4.3% |
| Austrians | 99.0 /100 | #64 | Exceptional 4.3% |
| Immigrants | Sudan | 99.0 /100 | #65 | Exceptional 4.3% |
| Turks | 98.9 /100 | #66 | Exceptional 4.3% |
| Immigrants | Nepal | 98.9 /100 | #67 | Exceptional 4.3% |
| Slovaks | 98.8 /100 | #68 | Exceptional 4.3% |
| Immigrants | Japan | 98.7 /100 | #69 | Exceptional 4.3% |
| Paraguayans | 98.6 /100 | #70 | Exceptional 4.3% |
| Palestinians | 98.5 /100 | #71 | Exceptional 4.3% |
| Whites/Caucasians | 98.4 /100 | #72 | Exceptional 4.3% |
| Canadians | 98.2 /100 | #73 | Exceptional 4.3% |
| Immigrants | Belgium | 98.2 /100 | #74 | Exceptional 4.3% |
| Kenyans | 98.1 /100 | #75 | Exceptional 4.3% |