Sioux vs Immigrants from Taiwan Female Unemployment
COMPARE
Sioux
Immigrants from Taiwan
Female Unemployment
Female Unemployment Comparison
Sioux
Immigrants from Taiwan
7.0%
FEMALE UNEMPLOYMENT
0.0/ 100
METRIC RATING
332nd/ 347
METRIC RANK
5.0%
FEMALE UNEMPLOYMENT
96.6/ 100
METRIC RATING
89th/ 347
METRIC RANK
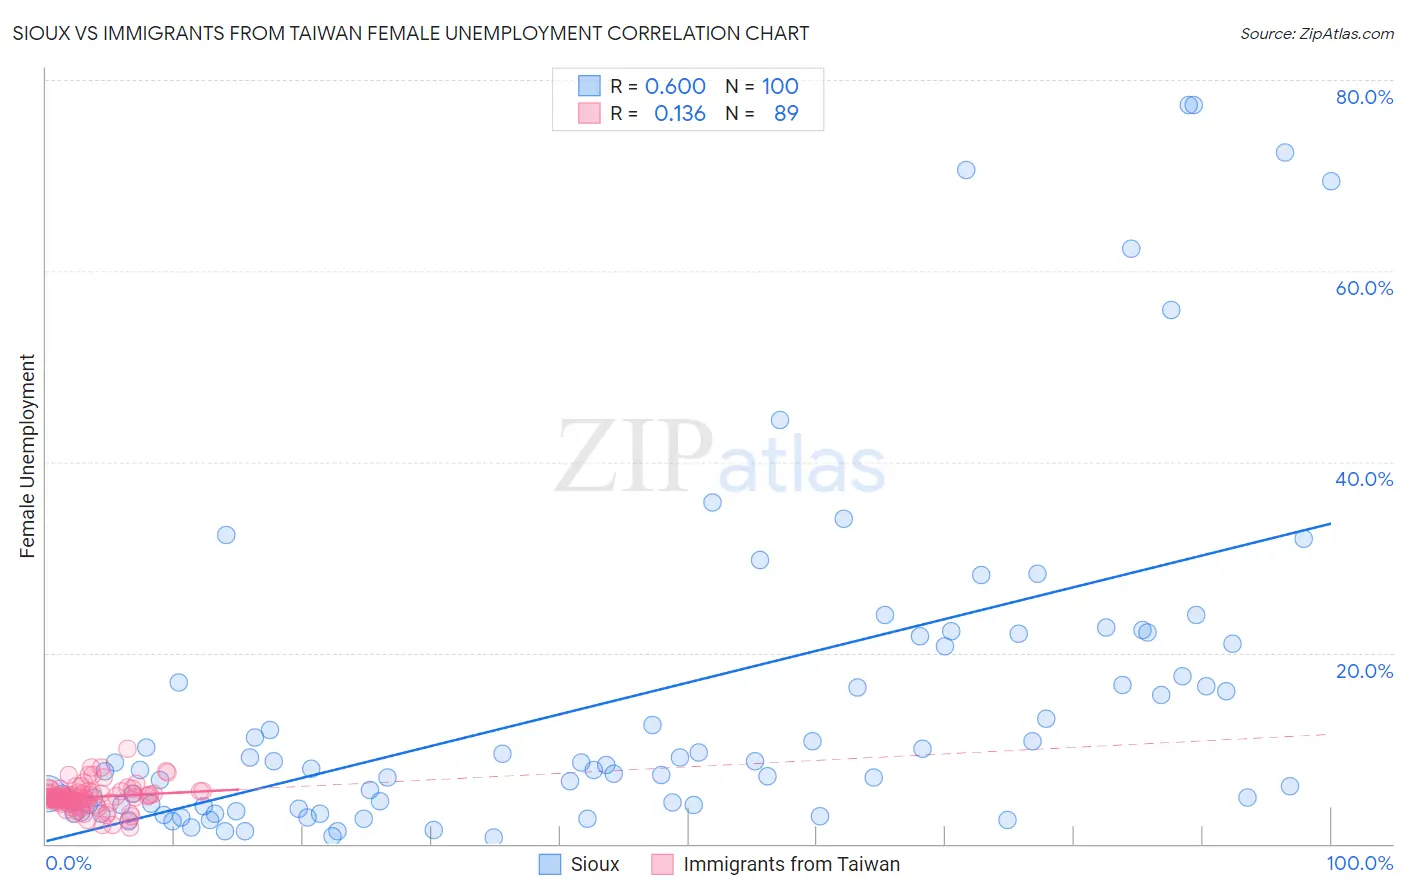
Sioux vs Immigrants from Taiwan Female Unemployment Correlation Chart
The statistical analysis conducted on geographies consisting of 232,785,612 people shows a significant positive correlation between the proportion of Sioux and unemploymnet rate among females in the United States with a correlation coefficient (R) of 0.600 and weighted average of 7.0%. Similarly, the statistical analysis conducted on geographies consisting of 297,604,617 people shows a poor positive correlation between the proportion of Immigrants from Taiwan and unemploymnet rate among females in the United States with a correlation coefficient (R) of 0.136 and weighted average of 5.0%, a difference of 41.1%.
Female Unemployment Correlation Summary
| Measurement | Sioux | Immigrants from Taiwan |
| Minimum | 0.60% | 1.7% |
| Maximum | 77.4% | 9.9% |
| Range | 76.8% | 8.2% |
| Mean | 14.7% | 4.9% |
| Median | 7.8% | 4.9% |
| Interquartile 25% (IQ1) | 4.0% | 4.3% |
| Interquartile 75% (IQ3) | 19.1% | 5.4% |
| Interquartile Range (IQR) | 15.1% | 1.1% |
| Standard Deviation (Sample) | 17.7% | 1.4% |
| Standard Deviation (Population) | 17.6% | 1.4% |
Similar Demographics by Female Unemployment
Demographics Similar to Sioux by Female Unemployment
In terms of female unemployment, the demographic groups most similar to Sioux are Menominee (7.0%, a difference of 0.020%), Immigrants from Armenia (7.1%, a difference of 0.44%), Dominican (7.2%, a difference of 1.8%), Immigrants from Dominican Republic (7.2%, a difference of 2.5%), and Navajo (7.3%, a difference of 3.5%).
| Demographics | Rating | Rank | Female Unemployment |
| Apache | 0.0 /100 | #325 | Tragic 6.6% |
| Natives/Alaskans | 0.0 /100 | #326 | Tragic 6.6% |
| Alaska Natives | 0.0 /100 | #327 | Tragic 6.6% |
| Guyanese | 0.0 /100 | #328 | Tragic 6.7% |
| Immigrants | Guyana | 0.0 /100 | #329 | Tragic 6.7% |
| Yakama | 0.0 /100 | #330 | Tragic 6.7% |
| Paiute | 0.0 /100 | #331 | Tragic 6.8% |
| Sioux | 0.0 /100 | #332 | Tragic 7.0% |
| Menominee | 0.0 /100 | #333 | Tragic 7.0% |
| Immigrants | Armenia | 0.0 /100 | #334 | Tragic 7.1% |
| Dominicans | 0.0 /100 | #335 | Tragic 7.2% |
| Immigrants | Dominican Republic | 0.0 /100 | #336 | Tragic 7.2% |
| Navajo | 0.0 /100 | #337 | Tragic 7.3% |
| Tohono O'odham | 0.0 /100 | #338 | Tragic 7.7% |
| Immigrants | Yemen | 0.0 /100 | #339 | Tragic 7.8% |
Demographics Similar to Immigrants from Taiwan by Female Unemployment
In terms of female unemployment, the demographic groups most similar to Immigrants from Taiwan are Immigrants from Sudan (5.0%, a difference of 0.060%), Venezuelan (5.0%, a difference of 0.15%), Immigrants from Sweden (5.0%, a difference of 0.17%), Bolivian (5.0%, a difference of 0.23%), and Ukrainian (5.0%, a difference of 0.24%).
| Demographics | Rating | Rank | Female Unemployment |
| Immigrants | Australia | 97.3 /100 | #82 | Exceptional 5.0% |
| Immigrants | Serbia | 97.2 /100 | #83 | Exceptional 5.0% |
| Canadians | 97.2 /100 | #84 | Exceptional 5.0% |
| Ukrainians | 97.1 /100 | #85 | Exceptional 5.0% |
| Bolivians | 97.1 /100 | #86 | Exceptional 5.0% |
| Venezuelans | 96.9 /100 | #87 | Exceptional 5.0% |
| Immigrants | Sudan | 96.7 /100 | #88 | Exceptional 5.0% |
| Immigrants | Taiwan | 96.6 /100 | #89 | Exceptional 5.0% |
| Immigrants | Sweden | 96.3 /100 | #90 | Exceptional 5.0% |
| Immigrants | Japan | 96.0 /100 | #91 | Exceptional 5.0% |
| Romanians | 95.9 /100 | #92 | Exceptional 5.0% |
| Immigrants | Austria | 95.7 /100 | #93 | Exceptional 5.0% |
| Immigrants | Malaysia | 95.7 /100 | #94 | Exceptional 5.0% |
| Burmese | 95.6 /100 | #95 | Exceptional 5.0% |
| Immigrants | South Central Asia | 95.5 /100 | #96 | Exceptional 5.0% |