Sioux vs Immigrants from Russia Unemployment Among Ages 55 to 59 years
COMPARE
Sioux
Immigrants from Russia
Unemployment Among Ages 55 to 59 years
Unemployment Among Ages 55 to 59 years Comparison
Sioux
Immigrants from Russia
5.3%
UNEMPLOYMENT AMONG AGES 55 TO 59 YEARS
0.0/ 100
METRIC RATING
290th/ 347
METRIC RANK
4.9%
UNEMPLOYMENT AMONG AGES 55 TO 59 YEARS
23.7/ 100
METRIC RATING
199th/ 347
METRIC RANK
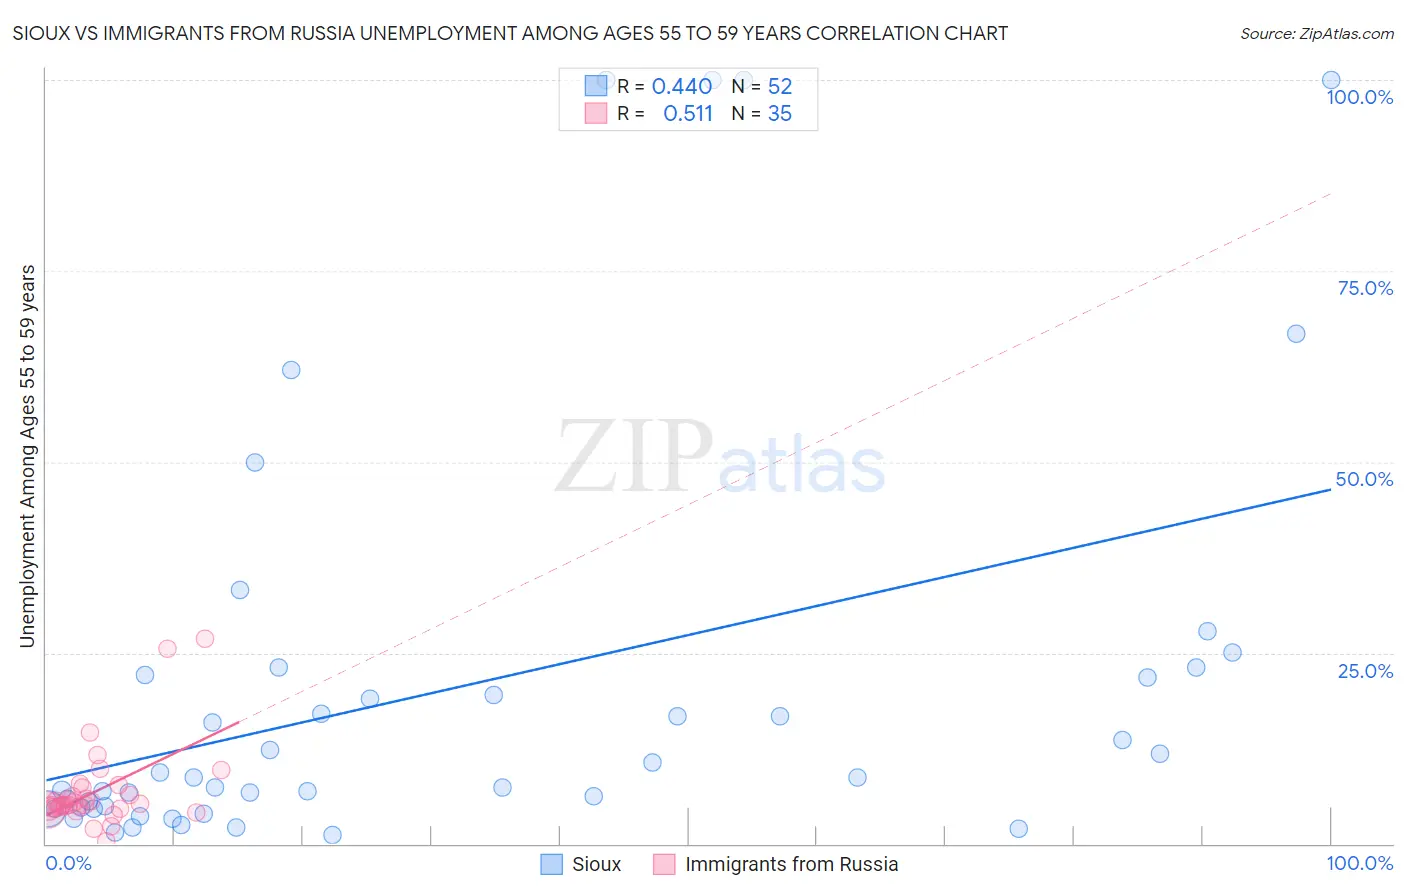
Sioux vs Immigrants from Russia Unemployment Among Ages 55 to 59 years Correlation Chart
The statistical analysis conducted on geographies consisting of 219,166,011 people shows a moderate positive correlation between the proportion of Sioux and unemployment rate among population between the ages 55 and 59 in the United States with a correlation coefficient (R) of 0.440 and weighted average of 5.3%. Similarly, the statistical analysis conducted on geographies consisting of 327,176,898 people shows a substantial positive correlation between the proportion of Immigrants from Russia and unemployment rate among population between the ages 55 and 59 in the United States with a correlation coefficient (R) of 0.511 and weighted average of 4.9%, a difference of 8.7%.
Unemployment Among Ages 55 to 59 years Correlation Summary
| Measurement | Sioux | Immigrants from Russia |
| Minimum | 1.1% | 0.40% |
| Maximum | 100.0% | 26.8% |
| Range | 98.9% | 26.4% |
| Mean | 20.2% | 6.9% |
| Median | 8.7% | 5.1% |
| Interquartile 25% (IQ1) | 4.7% | 4.6% |
| Interquartile 75% (IQ3) | 21.9% | 7.4% |
| Interquartile Range (IQR) | 17.3% | 2.8% |
| Standard Deviation (Sample) | 27.1% | 5.5% |
| Standard Deviation (Population) | 26.8% | 5.4% |
Similar Demographics by Unemployment Among Ages 55 to 59 years
Demographics Similar to Sioux by Unemployment Among Ages 55 to 59 years
In terms of unemployment among ages 55 to 59 years, the demographic groups most similar to Sioux are Immigrants from Central America (5.3%, a difference of 0.030%), Trinidadian and Tobagonian (5.3%, a difference of 0.070%), Immigrants from Israel (5.3%, a difference of 0.090%), Immigrants from Guatemala (5.3%, a difference of 0.10%), and Immigrants from Ghana (5.3%, a difference of 0.12%).
| Demographics | Rating | Rank | Unemployment Among Ages 55 to 59 years |
| Apache | 0.0 /100 | #283 | Tragic 5.3% |
| Ghanaians | 0.0 /100 | #284 | Tragic 5.3% |
| Armenians | 0.0 /100 | #285 | Tragic 5.3% |
| Immigrants | Ghana | 0.0 /100 | #286 | Tragic 5.3% |
| Immigrants | Guatemala | 0.0 /100 | #287 | Tragic 5.3% |
| Immigrants | Israel | 0.0 /100 | #288 | Tragic 5.3% |
| Immigrants | Central America | 0.0 /100 | #289 | Tragic 5.3% |
| Sioux | 0.0 /100 | #290 | Tragic 5.3% |
| Trinidadians and Tobagonians | 0.0 /100 | #291 | Tragic 5.3% |
| British West Indians | 0.0 /100 | #292 | Tragic 5.3% |
| Immigrants | Grenada | 0.0 /100 | #293 | Tragic 5.3% |
| Cajuns | 0.0 /100 | #294 | Tragic 5.3% |
| Dutch West Indians | 0.0 /100 | #295 | Tragic 5.3% |
| Barbadians | 0.0 /100 | #296 | Tragic 5.3% |
| Immigrants | Mexico | 0.0 /100 | #297 | Tragic 5.3% |
Demographics Similar to Immigrants from Russia by Unemployment Among Ages 55 to 59 years
In terms of unemployment among ages 55 to 59 years, the demographic groups most similar to Immigrants from Russia are Basque (4.9%, a difference of 0.020%), Immigrants from South America (4.9%, a difference of 0.030%), Lumbee (4.9%, a difference of 0.070%), Immigrants from Philippines (4.9%, a difference of 0.13%), and Macedonian (4.9%, a difference of 0.15%).
| Demographics | Rating | Rank | Unemployment Among Ages 55 to 59 years |
| Immigrants | Ukraine | 31.7 /100 | #192 | Fair 4.9% |
| Immigrants | Italy | 30.1 /100 | #193 | Fair 4.9% |
| Spaniards | 27.2 /100 | #194 | Fair 4.9% |
| Estonians | 27.2 /100 | #195 | Fair 4.9% |
| Eastern Europeans | 26.7 /100 | #196 | Fair 4.9% |
| Macedonians | 26.4 /100 | #197 | Fair 4.9% |
| Immigrants | Philippines | 26.1 /100 | #198 | Fair 4.9% |
| Immigrants | Russia | 23.7 /100 | #199 | Fair 4.9% |
| Basques | 23.3 /100 | #200 | Fair 4.9% |
| Immigrants | South America | 23.1 /100 | #201 | Fair 4.9% |
| Lumbee | 22.5 /100 | #202 | Fair 4.9% |
| Guamanians/Chamorros | 20.8 /100 | #203 | Fair 4.9% |
| Immigrants | Latvia | 18.5 /100 | #204 | Poor 4.9% |
| Haitians | 18.1 /100 | #205 | Poor 4.9% |
| Immigrants | Belarus | 14.1 /100 | #206 | Poor 4.9% |