Sierra Leonean vs Immigrants from France Unemployment Among Women with Children Under 18 years
COMPARE
Sierra Leonean
Immigrants from France
Unemployment Among Women with Children Under 18 years
Unemployment Among Women with Children Under 18 years Comparison
Sierra Leoneans
Immigrants from France
5.8%
UNEMPLOYMENT AMONG WOMEN WITH CHILDREN UNDER 18 YEARS
3.8/ 100
METRIC RATING
227th/ 347
METRIC RANK
5.2%
UNEMPLOYMENT AMONG WOMEN WITH CHILDREN UNDER 18 YEARS
90.0/ 100
METRIC RATING
105th/ 347
METRIC RANK
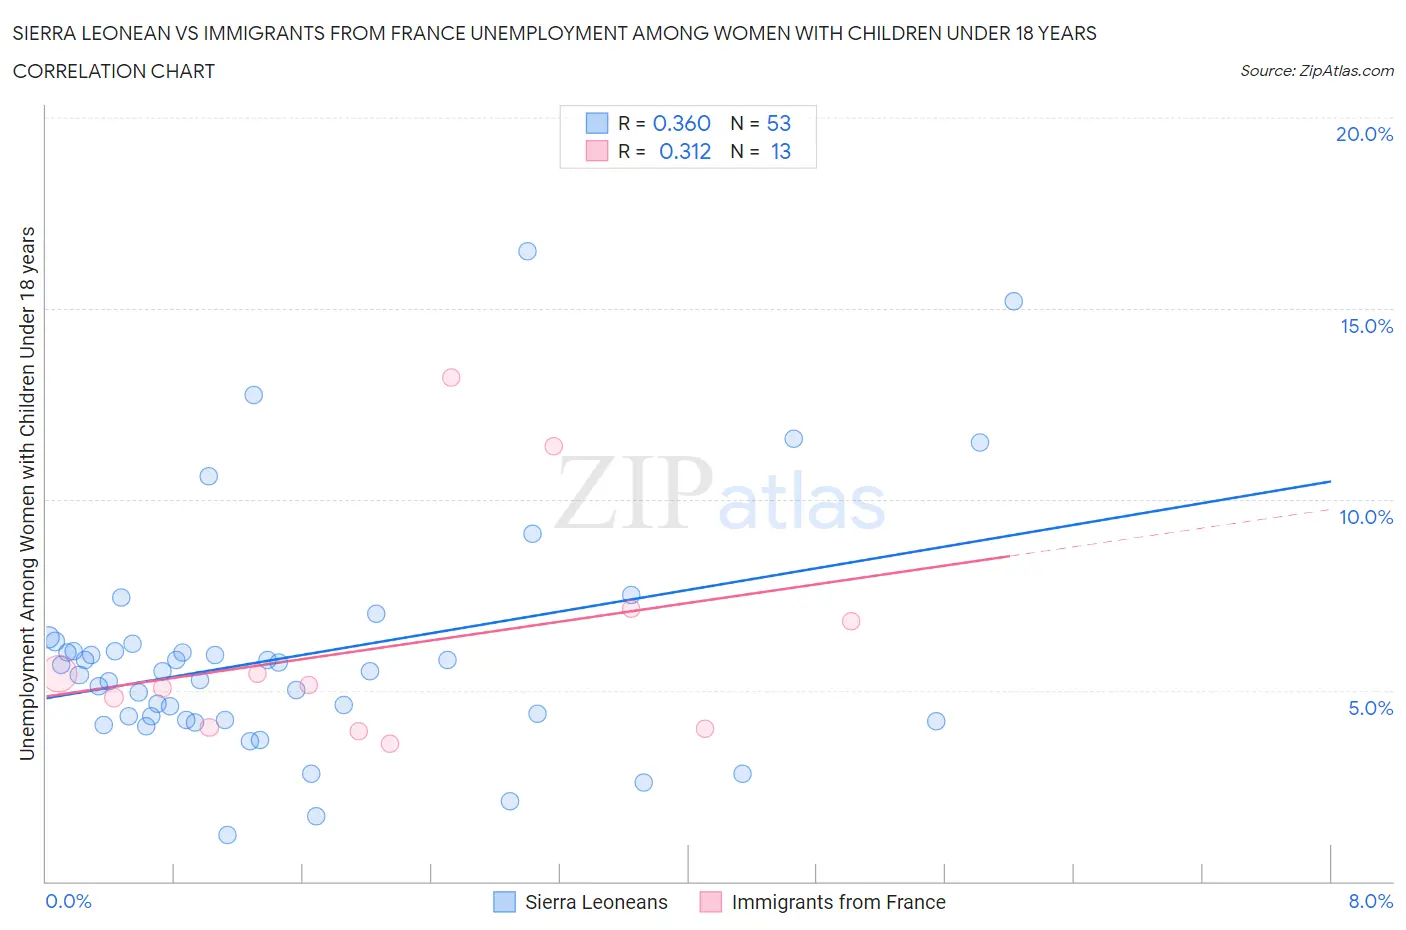
Sierra Leonean vs Immigrants from France Unemployment Among Women with Children Under 18 years Correlation Chart
The statistical analysis conducted on geographies consisting of 82,735,837 people shows a mild positive correlation between the proportion of Sierra Leoneans and unemployment rate among women with children under the age of 18 in the United States with a correlation coefficient (R) of 0.360 and weighted average of 5.8%. Similarly, the statistical analysis conducted on geographies consisting of 280,158,664 people shows a mild positive correlation between the proportion of Immigrants from France and unemployment rate among women with children under the age of 18 in the United States with a correlation coefficient (R) of 0.312 and weighted average of 5.2%, a difference of 10.0%.
Unemployment Among Women with Children Under 18 years Correlation Summary
| Measurement | Sierra Leonean | Immigrants from France |
| Minimum | 1.2% | 3.6% |
| Maximum | 16.5% | 13.2% |
| Range | 15.3% | 9.6% |
| Mean | 5.9% | 6.1% |
| Median | 5.5% | 5.1% |
| Interquartile 25% (IQ1) | 4.2% | 4.0% |
| Interquartile 75% (IQ3) | 6.1% | 7.0% |
| Interquartile Range (IQR) | 1.9% | 3.0% |
| Standard Deviation (Sample) | 3.0% | 2.9% |
| Standard Deviation (Population) | 3.0% | 2.8% |
Similar Demographics by Unemployment Among Women with Children Under 18 years
Demographics Similar to Sierra Leoneans by Unemployment Among Women with Children Under 18 years
In terms of unemployment among women with children under 18 years, the demographic groups most similar to Sierra Leoneans are Somali (5.8%, a difference of 0.14%), Cherokee (5.7%, a difference of 0.20%), Immigrants from Panama (5.8%, a difference of 0.23%), Armenian (5.7%, a difference of 0.27%), and Immigrants from South America (5.8%, a difference of 0.29%).
| Demographics | Rating | Rank | Unemployment Among Women with Children Under 18 years |
| Immigrants | Fiji | 6.3 /100 | #220 | Tragic 5.7% |
| Pennsylvania Germans | 5.7 /100 | #221 | Tragic 5.7% |
| Osage | 5.0 /100 | #222 | Tragic 5.7% |
| Potawatomi | 5.0 /100 | #223 | Tragic 5.7% |
| Immigrants | Syria | 4.6 /100 | #224 | Tragic 5.7% |
| Armenians | 4.5 /100 | #225 | Tragic 5.7% |
| Cherokee | 4.3 /100 | #226 | Tragic 5.7% |
| Sierra Leoneans | 3.8 /100 | #227 | Tragic 5.8% |
| Somalis | 3.5 /100 | #228 | Tragic 5.8% |
| Immigrants | Panama | 3.4 /100 | #229 | Tragic 5.8% |
| Immigrants | South America | 3.2 /100 | #230 | Tragic 5.8% |
| Immigrants | Africa | 3.1 /100 | #231 | Tragic 5.8% |
| Creek | 3.1 /100 | #232 | Tragic 5.8% |
| Spanish Americans | 3.1 /100 | #233 | Tragic 5.8% |
| Guamanians/Chamorros | 2.9 /100 | #234 | Tragic 5.8% |
Demographics Similar to Immigrants from France by Unemployment Among Women with Children Under 18 years
In terms of unemployment among women with children under 18 years, the demographic groups most similar to Immigrants from France are Immigrants from Switzerland (5.2%, a difference of 0.020%), Pakistani (5.2%, a difference of 0.020%), Slavic (5.2%, a difference of 0.030%), Sri Lankan (5.2%, a difference of 0.060%), and Iranian (5.2%, a difference of 0.070%).
| Demographics | Rating | Rank | Unemployment Among Women with Children Under 18 years |
| Immigrants | Vietnam | 92.0 /100 | #98 | Exceptional 5.2% |
| Cubans | 91.8 /100 | #99 | Exceptional 5.2% |
| Immigrants | Greece | 91.4 /100 | #100 | Exceptional 5.2% |
| Immigrants | Netherlands | 91.0 /100 | #101 | Exceptional 5.2% |
| Immigrants | Cuba | 90.9 /100 | #102 | Exceptional 5.2% |
| Sri Lankans | 90.3 /100 | #103 | Exceptional 5.2% |
| Immigrants | Switzerland | 90.1 /100 | #104 | Exceptional 5.2% |
| Immigrants | France | 90.0 /100 | #105 | Excellent 5.2% |
| Pakistanis | 89.9 /100 | #106 | Excellent 5.2% |
| Slavs | 89.8 /100 | #107 | Excellent 5.2% |
| Iranians | 89.7 /100 | #108 | Excellent 5.2% |
| Immigrants | Russia | 89.0 /100 | #109 | Excellent 5.2% |
| Immigrants | Czechoslovakia | 88.9 /100 | #110 | Excellent 5.2% |
| French Canadians | 88.9 /100 | #111 | Excellent 5.2% |
| Immigrants | Eastern Europe | 88.5 /100 | #112 | Excellent 5.2% |