Shoshone vs Dutch Unemployment Among Ages 35 to 44 years
COMPARE
Shoshone
Dutch
Unemployment Among Ages 35 to 44 years
Unemployment Among Ages 35 to 44 years Comparison
Shoshone
Dutch
6.6%
UNEMPLOYMENT AMONG AGES 35 TO 44 YEARS
0.0/ 100
METRIC RATING
328th/ 347
METRIC RANK
4.4%
UNEMPLOYMENT AMONG AGES 35 TO 44 YEARS
96.1/ 100
METRIC RATING
77th/ 347
METRIC RANK
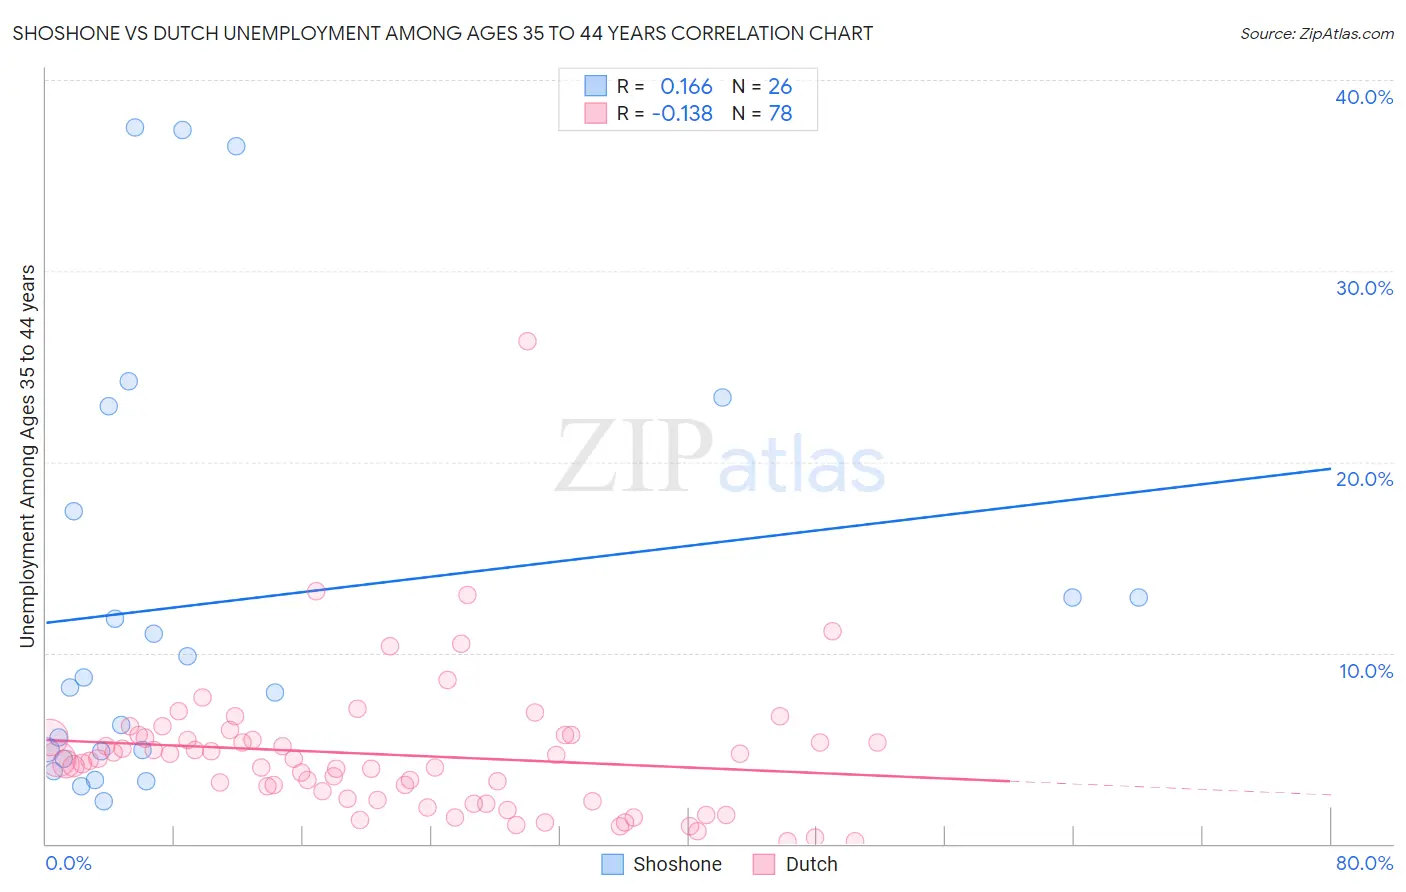
Shoshone vs Dutch Unemployment Among Ages 35 to 44 years Correlation Chart
The statistical analysis conducted on geographies consisting of 66,150,658 people shows a poor positive correlation between the proportion of Shoshone and unemployment rate among population between the ages 35 and 44 in the United States with a correlation coefficient (R) of 0.166 and weighted average of 6.6%. Similarly, the statistical analysis conducted on geographies consisting of 518,885,936 people shows a poor negative correlation between the proportion of Dutch and unemployment rate among population between the ages 35 and 44 in the United States with a correlation coefficient (R) of -0.138 and weighted average of 4.4%, a difference of 49.4%.
Unemployment Among Ages 35 to 44 years Correlation Summary
| Measurement | Shoshone | Dutch |
| Minimum | 2.2% | 0.10% |
| Maximum | 37.5% | 26.3% |
| Range | 35.3% | 26.2% |
| Mean | 12.7% | 4.7% |
| Median | 8.5% | 4.4% |
| Interquartile 25% (IQ1) | 4.9% | 2.3% |
| Interquartile 75% (IQ3) | 17.4% | 5.6% |
| Interquartile Range (IQR) | 12.5% | 3.2% |
| Standard Deviation (Sample) | 11.0% | 3.7% |
| Standard Deviation (Population) | 10.8% | 3.7% |
Similar Demographics by Unemployment Among Ages 35 to 44 years
Demographics Similar to Shoshone by Unemployment Among Ages 35 to 44 years
In terms of unemployment among ages 35 to 44 years, the demographic groups most similar to Shoshone are Cape Verdean (6.6%, a difference of 0.69%), Alaska Native (6.6%, a difference of 0.74%), Immigrants from Yemen (6.6%, a difference of 0.81%), Menominee (6.5%, a difference of 1.2%), and Dominican (6.4%, a difference of 2.8%).
| Demographics | Rating | Rank | Unemployment Among Ages 35 to 44 years |
| Chippewa | 0.0 /100 | #321 | Tragic 6.2% |
| Immigrants | Dominican Republic | 0.0 /100 | #322 | Tragic 6.4% |
| Dominicans | 0.0 /100 | #323 | Tragic 6.4% |
| Menominee | 0.0 /100 | #324 | Tragic 6.5% |
| Immigrants | Yemen | 0.0 /100 | #325 | Tragic 6.6% |
| Alaska Natives | 0.0 /100 | #326 | Tragic 6.6% |
| Cape Verdeans | 0.0 /100 | #327 | Tragic 6.6% |
| Shoshone | 0.0 /100 | #328 | Tragic 6.6% |
| Paiute | 0.0 /100 | #329 | Tragic 6.9% |
| Immigrants | Cabo Verde | 0.0 /100 | #330 | Tragic 6.9% |
| Pueblo | 0.0 /100 | #331 | Tragic 7.1% |
| Natives/Alaskans | 0.0 /100 | #332 | Tragic 7.3% |
| Puerto Ricans | 0.0 /100 | #333 | Tragic 7.6% |
| Houma | 0.0 /100 | #334 | Tragic 7.8% |
| Sioux | 0.0 /100 | #335 | Tragic 8.4% |
Demographics Similar to Dutch by Unemployment Among Ages 35 to 44 years
In terms of unemployment among ages 35 to 44 years, the demographic groups most similar to Dutch are Indian (Asian) (4.4%, a difference of 0.060%), Immigrants from Jordan (4.4%, a difference of 0.080%), Immigrants from Romania (4.4%, a difference of 0.11%), Immigrants from Sweden (4.4%, a difference of 0.11%), and Polish (4.4%, a difference of 0.14%).
| Demographics | Rating | Rank | Unemployment Among Ages 35 to 44 years |
| Immigrants | China | 96.7 /100 | #70 | Exceptional 4.4% |
| Immigrants | Lithuania | 96.7 /100 | #71 | Exceptional 4.4% |
| Northern Europeans | 96.5 /100 | #72 | Exceptional 4.4% |
| Lithuanians | 96.5 /100 | #73 | Exceptional 4.4% |
| Poles | 96.4 /100 | #74 | Exceptional 4.4% |
| Immigrants | Romania | 96.3 /100 | #75 | Exceptional 4.4% |
| Immigrants | Jordan | 96.3 /100 | #76 | Exceptional 4.4% |
| Dutch | 96.1 /100 | #77 | Exceptional 4.4% |
| Indians (Asian) | 96.0 /100 | #78 | Exceptional 4.4% |
| Immigrants | Sweden | 95.9 /100 | #79 | Exceptional 4.4% |
| Kenyans | 95.7 /100 | #80 | Exceptional 4.4% |
| Immigrants | Scotland | 95.6 /100 | #81 | Exceptional 4.4% |
| Immigrants | Asia | 95.6 /100 | #82 | Exceptional 4.4% |
| Immigrants | Australia | 95.3 /100 | #83 | Exceptional 4.4% |
| Immigrants | Chile | 95.2 /100 | #84 | Exceptional 4.4% |