Serbian vs Kiowa Unemployment Among Women with Children Under 6 years
COMPARE
Serbian
Kiowa
Unemployment Among Women with Children Under 6 years
Unemployment Among Women with Children Under 6 years Comparison
Serbians
Kiowa
7.3%
UNEMPLOYMENT AMONG WOMEN WITH CHILDREN UNDER 6 YEARS
94.5/ 100
METRIC RATING
118th/ 347
METRIC RANK
8.0%
UNEMPLOYMENT AMONG WOMEN WITH CHILDREN UNDER 6 YEARS
4.4/ 100
METRIC RATING
234th/ 347
METRIC RANK
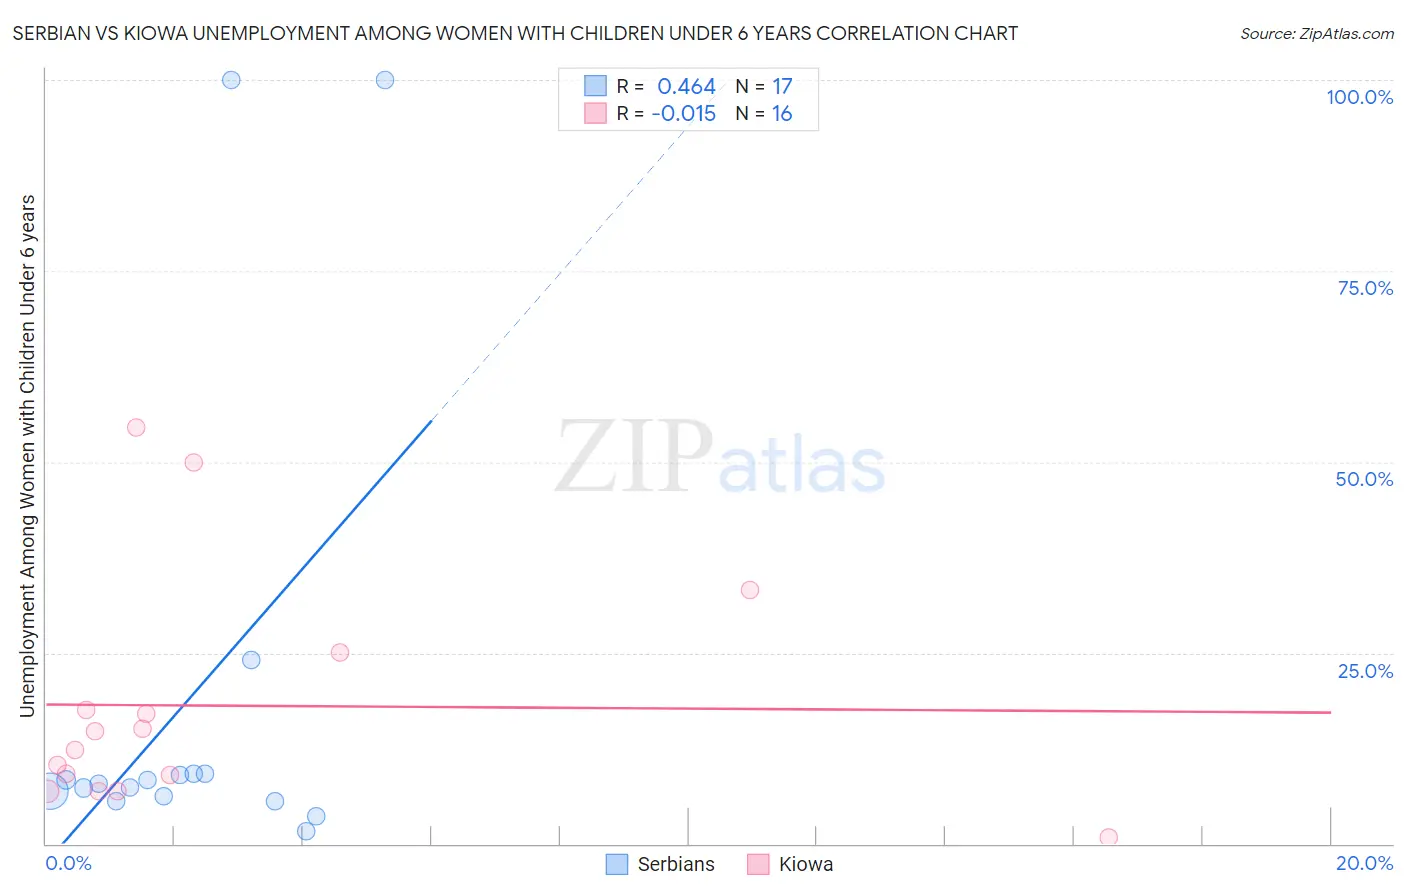
Serbian vs Kiowa Unemployment Among Women with Children Under 6 years Correlation Chart
The statistical analysis conducted on geographies consisting of 212,728,717 people shows a moderate positive correlation between the proportion of Serbians and unemployment rate among women with children under the age of 6 in the United States with a correlation coefficient (R) of 0.464 and weighted average of 7.3%. Similarly, the statistical analysis conducted on geographies consisting of 51,955,619 people shows no correlation between the proportion of Kiowa and unemployment rate among women with children under the age of 6 in the United States with a correlation coefficient (R) of -0.015 and weighted average of 8.0%, a difference of 10.3%.
Unemployment Among Women with Children Under 6 years Correlation Summary
| Measurement | Serbian | Kiowa |
| Minimum | 1.6% | 0.90% |
| Maximum | 100.0% | 54.5% |
| Range | 98.4% | 53.6% |
| Mean | 18.8% | 18.1% |
| Median | 7.9% | 13.5% |
| Interquartile 25% (IQ1) | 5.9% | 8.0% |
| Interquartile 75% (IQ3) | 9.1% | 21.2% |
| Interquartile Range (IQR) | 3.2% | 13.2% |
| Standard Deviation (Sample) | 30.9% | 15.4% |
| Standard Deviation (Population) | 30.0% | 15.0% |
Similar Demographics by Unemployment Among Women with Children Under 6 years
Demographics Similar to Serbians by Unemployment Among Women with Children Under 6 years
In terms of unemployment among women with children under 6 years, the demographic groups most similar to Serbians are South African (7.3%, a difference of 0.11%), Iraqi (7.3%, a difference of 0.18%), Immigrants from Chile (7.3%, a difference of 0.30%), Immigrants from Bosnia and Herzegovina (7.3%, a difference of 0.31%), and Immigrants from Kenya (7.3%, a difference of 0.33%).
| Demographics | Rating | Rank | Unemployment Among Women with Children Under 6 years |
| Norwegians | 96.7 /100 | #111 | Exceptional 7.2% |
| Israelis | 96.5 /100 | #112 | Exceptional 7.2% |
| Nicaraguans | 96.3 /100 | #113 | Exceptional 7.2% |
| Argentineans | 96.2 /100 | #114 | Exceptional 7.2% |
| Immigrants | Italy | 96.1 /100 | #115 | Exceptional 7.2% |
| Armenians | 95.9 /100 | #116 | Exceptional 7.2% |
| Immigrants | Kenya | 95.4 /100 | #117 | Exceptional 7.3% |
| Serbians | 94.5 /100 | #118 | Exceptional 7.3% |
| South Africans | 94.1 /100 | #119 | Exceptional 7.3% |
| Iraqis | 93.9 /100 | #120 | Exceptional 7.3% |
| Immigrants | Chile | 93.5 /100 | #121 | Exceptional 7.3% |
| Immigrants | Bosnia and Herzegovina | 93.5 /100 | #122 | Exceptional 7.3% |
| Immigrants | Zaire | 93.3 /100 | #123 | Exceptional 7.3% |
| Immigrants | South Africa | 92.5 /100 | #124 | Exceptional 7.3% |
| Pakistanis | 92.2 /100 | #125 | Exceptional 7.3% |
Demographics Similar to Kiowa by Unemployment Among Women with Children Under 6 years
In terms of unemployment among women with children under 6 years, the demographic groups most similar to Kiowa are Comanche (8.0%, a difference of 0.040%), Immigrants from Barbados (8.0%, a difference of 0.050%), Immigrants from Costa Rica (8.0%, a difference of 0.12%), Immigrants from Trinidad and Tobago (8.0%, a difference of 0.15%), and Welsh (8.0%, a difference of 0.23%).
| Demographics | Rating | Rank | Unemployment Among Women with Children Under 6 years |
| Portuguese | 6.2 /100 | #227 | Tragic 8.0% |
| Immigrants | Sudan | 6.0 /100 | #228 | Tragic 8.0% |
| Salvadorans | 5.5 /100 | #229 | Tragic 8.0% |
| Finns | 5.3 /100 | #230 | Tragic 8.0% |
| Trinidadians and Tobagonians | 5.3 /100 | #231 | Tragic 8.0% |
| Welsh | 5.0 /100 | #232 | Tragic 8.0% |
| Immigrants | Trinidad and Tobago | 4.8 /100 | #233 | Tragic 8.0% |
| Kiowa | 4.4 /100 | #234 | Tragic 8.0% |
| Comanche | 4.3 /100 | #235 | Tragic 8.0% |
| Immigrants | Barbados | 4.2 /100 | #236 | Tragic 8.0% |
| Immigrants | Costa Rica | 4.1 /100 | #237 | Tragic 8.0% |
| Immigrants | Middle Africa | 3.2 /100 | #238 | Tragic 8.1% |
| Irish | 2.7 /100 | #239 | Tragic 8.1% |
| Immigrants | El Salvador | 2.6 /100 | #240 | Tragic 8.1% |
| Liberians | 2.6 /100 | #241 | Tragic 8.1% |