Serbian vs Immigrants from India Unemployment Among Youth under 25 years
COMPARE
Serbian
Immigrants from India
Unemployment Among Youth under 25 years
Unemployment Among Youth under 25 years Comparison
Serbians
Immigrants from India
11.0%
UNEMPLOYMENT AMONG YOUTH UNDER 25 YEARS
99.0/ 100
METRIC RATING
51st/ 347
METRIC RANK
10.7%
UNEMPLOYMENT AMONG YOUTH UNDER 25 YEARS
100.0/ 100
METRIC RATING
26th/ 347
METRIC RANK
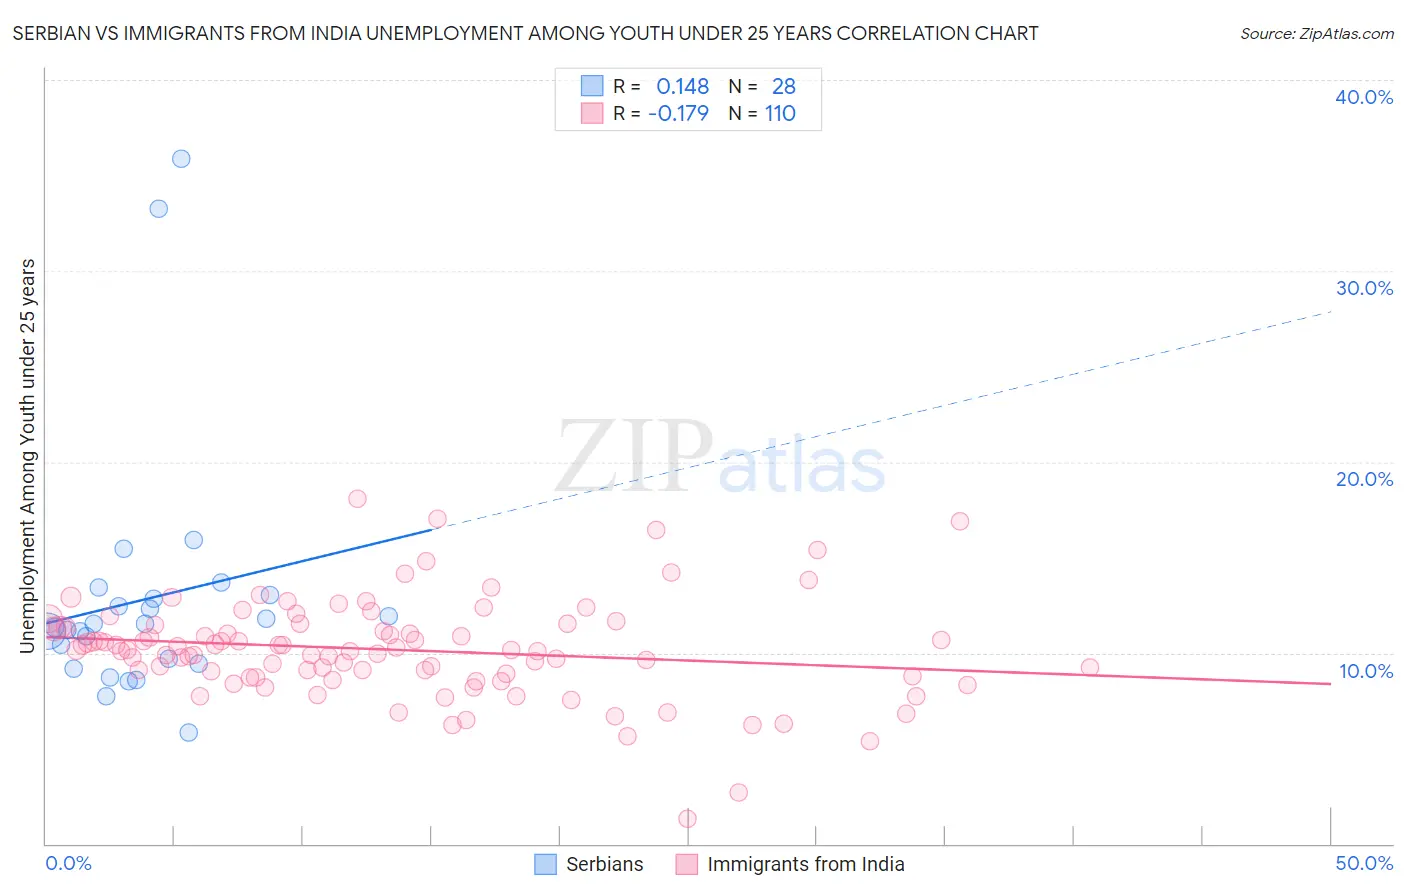
Serbian vs Immigrants from India Unemployment Among Youth under 25 years Correlation Chart
The statistical analysis conducted on geographies consisting of 265,082,156 people shows a poor positive correlation between the proportion of Serbians and unemployment rate among youth under the age of 25 in the United States with a correlation coefficient (R) of 0.148 and weighted average of 11.0%. Similarly, the statistical analysis conducted on geographies consisting of 428,221,215 people shows a poor negative correlation between the proportion of Immigrants from India and unemployment rate among youth under the age of 25 in the United States with a correlation coefficient (R) of -0.179 and weighted average of 10.7%, a difference of 3.6%.
Unemployment Among Youth under 25 years Correlation Summary
| Measurement | Serbian | Immigrants from India |
| Minimum | 5.8% | 1.3% |
| Maximum | 35.9% | 18.0% |
| Range | 30.1% | 16.7% |
| Mean | 12.8% | 10.2% |
| Median | 11.4% | 10.1% |
| Interquartile 25% (IQ1) | 9.6% | 8.8% |
| Interquartile 75% (IQ3) | 12.9% | 11.4% |
| Interquartile Range (IQR) | 3.4% | 2.6% |
| Standard Deviation (Sample) | 6.5% | 2.6% |
| Standard Deviation (Population) | 6.4% | 2.6% |
Similar Demographics by Unemployment Among Youth under 25 years
Demographics Similar to Serbians by Unemployment Among Youth under 25 years
In terms of unemployment among youth under 25 years, the demographic groups most similar to Serbians are Latvian (11.0%, a difference of 0.020%), Ottawa (11.1%, a difference of 0.10%), Mongolian (11.1%, a difference of 0.19%), Irish (11.1%, a difference of 0.19%), and Immigrants from Saudi Arabia (11.1%, a difference of 0.21%).
| Demographics | Rating | Rank | Unemployment Among Youth under 25 years |
| Welsh | 99.7 /100 | #44 | Exceptional 10.9% |
| Bulgarians | 99.6 /100 | #45 | Exceptional 10.9% |
| Tongans | 99.6 /100 | #46 | Exceptional 10.9% |
| Australians | 99.6 /100 | #47 | Exceptional 10.9% |
| Poles | 99.3 /100 | #48 | Exceptional 11.0% |
| Thais | 99.3 /100 | #49 | Exceptional 11.0% |
| Czechoslovakians | 99.2 /100 | #50 | Exceptional 11.0% |
| Serbians | 99.0 /100 | #51 | Exceptional 11.0% |
| Latvians | 99.0 /100 | #52 | Exceptional 11.0% |
| Ottawa | 99.0 /100 | #53 | Exceptional 11.1% |
| Mongolians | 98.9 /100 | #54 | Exceptional 11.1% |
| Irish | 98.9 /100 | #55 | Exceptional 11.1% |
| Immigrants | Saudi Arabia | 98.8 /100 | #56 | Exceptional 11.1% |
| Immigrants | Eritrea | 98.8 /100 | #57 | Exceptional 11.1% |
| Scotch-Irish | 98.8 /100 | #58 | Exceptional 11.1% |
Demographics Similar to Immigrants from India by Unemployment Among Youth under 25 years
In terms of unemployment among youth under 25 years, the demographic groups most similar to Immigrants from India are Yugoslavian (10.7%, a difference of 0.020%), Somali (10.7%, a difference of 0.060%), Finnish (10.7%, a difference of 0.10%), Immigrants from North Macedonia (10.7%, a difference of 0.10%), and Immigrants from Bosnia and Herzegovina (10.6%, a difference of 0.34%).
| Demographics | Rating | Rank | Unemployment Among Youth under 25 years |
| Immigrants | Burma/Myanmar | 100.0 /100 | #19 | Exceptional 10.6% |
| Dutch | 100.0 /100 | #20 | Exceptional 10.6% |
| Pennsylvania Germans | 100.0 /100 | #21 | Exceptional 10.6% |
| Belgians | 100.0 /100 | #22 | Exceptional 10.6% |
| Immigrants | Bosnia and Herzegovina | 100.0 /100 | #23 | Exceptional 10.6% |
| Finns | 100.0 /100 | #24 | Exceptional 10.7% |
| Immigrants | North Macedonia | 100.0 /100 | #25 | Exceptional 10.7% |
| Immigrants | India | 100.0 /100 | #26 | Exceptional 10.7% |
| Yugoslavians | 100.0 /100 | #27 | Exceptional 10.7% |
| Somalis | 100.0 /100 | #28 | Exceptional 10.7% |
| Chinese | 99.9 /100 | #29 | Exceptional 10.7% |
| Osage | 99.9 /100 | #30 | Exceptional 10.7% |
| Slovenes | 99.9 /100 | #31 | Exceptional 10.7% |
| Taiwanese | 99.9 /100 | #32 | Exceptional 10.8% |
| Europeans | 99.9 /100 | #33 | Exceptional 10.8% |