Serbian vs Guyanese Unemployment Among Ages 16 to 19 years
COMPARE
Serbian
Guyanese
Unemployment Among Ages 16 to 19 years
Unemployment Among Ages 16 to 19 years Comparison
Serbians
Guyanese
16.7%
UNEMPLOYMENT AMONG AGES 16 TO 19 YEARS
98.7/ 100
METRIC RATING
69th/ 347
METRIC RANK
24.8%
UNEMPLOYMENT AMONG AGES 16 TO 19 YEARS
0.0/ 100
METRIC RATING
334th/ 347
METRIC RANK
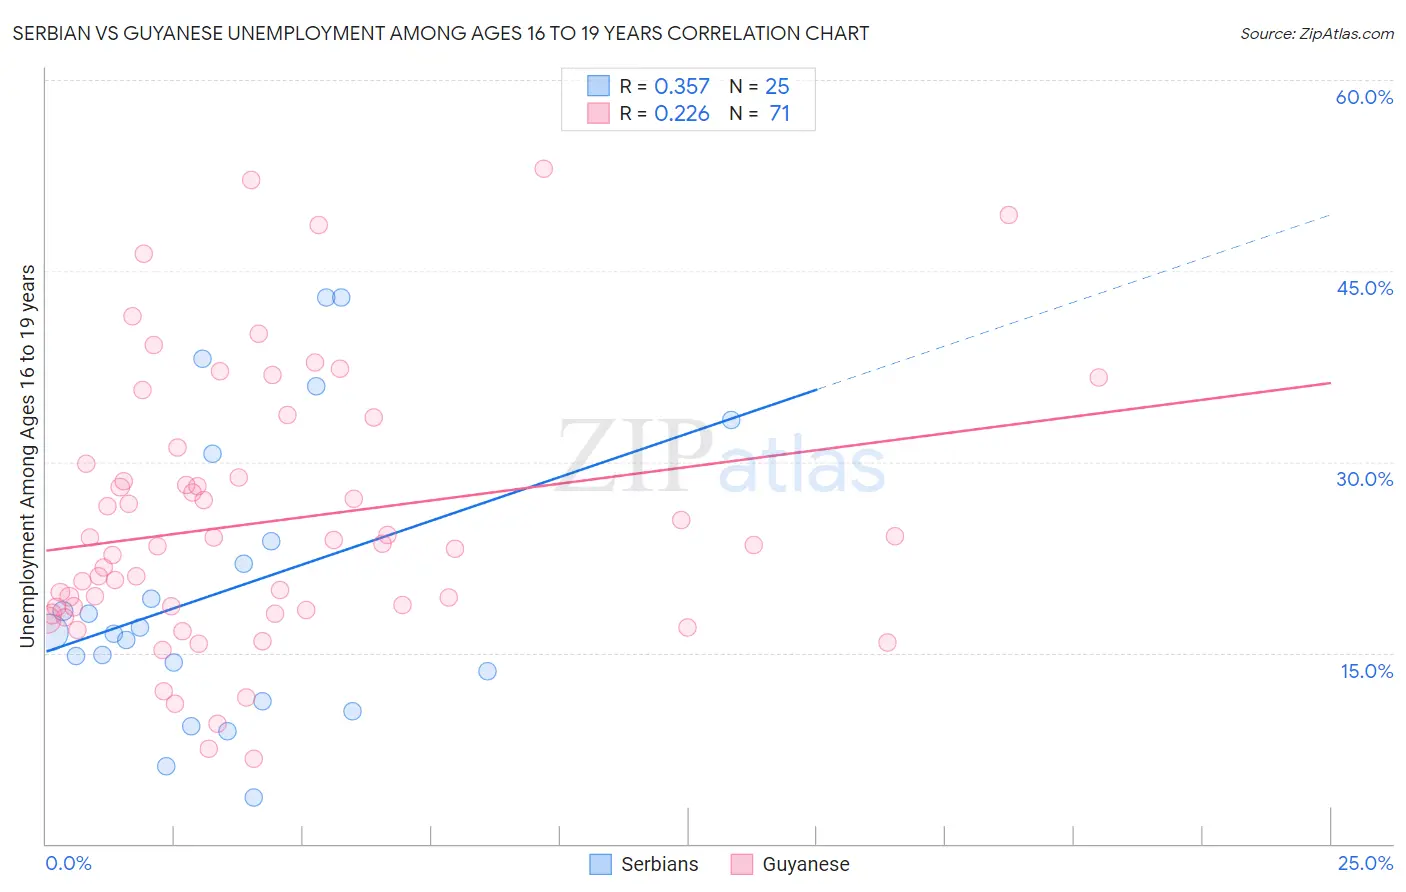
Serbian vs Guyanese Unemployment Among Ages 16 to 19 years Correlation Chart
The statistical analysis conducted on geographies consisting of 256,290,182 people shows a mild positive correlation between the proportion of Serbians and unemployment rate among population between the ages 16 and 19 in the United States with a correlation coefficient (R) of 0.357 and weighted average of 16.7%. Similarly, the statistical analysis conducted on geographies consisting of 172,403,884 people shows a weak positive correlation between the proportion of Guyanese and unemployment rate among population between the ages 16 and 19 in the United States with a correlation coefficient (R) of 0.226 and weighted average of 24.8%, a difference of 48.8%.
Unemployment Among Ages 16 to 19 years Correlation Summary
| Measurement | Serbian | Guyanese |
| Minimum | 3.6% | 6.7% |
| Maximum | 42.9% | 53.0% |
| Range | 39.3% | 46.3% |
| Mean | 19.9% | 25.3% |
| Median | 16.6% | 23.5% |
| Interquartile 25% (IQ1) | 12.4% | 18.4% |
| Interquartile 75% (IQ3) | 27.2% | 29.8% |
| Interquartile Range (IQR) | 14.8% | 11.5% |
| Standard Deviation (Sample) | 11.2% | 10.4% |
| Standard Deviation (Population) | 10.9% | 10.3% |
Similar Demographics by Unemployment Among Ages 16 to 19 years
Demographics Similar to Serbians by Unemployment Among Ages 16 to 19 years
In terms of unemployment among ages 16 to 19 years, the demographic groups most similar to Serbians are Austrian (16.7%, a difference of 0.060%), Chickasaw (16.7%, a difference of 0.070%), Slavic (16.7%, a difference of 0.080%), Latvian (16.7%, a difference of 0.13%), and Immigrants from Canada (16.7%, a difference of 0.16%).
| Demographics | Rating | Rank | Unemployment Among Ages 16 to 19 years |
| Macedonians | 99.2 /100 | #62 | Exceptional 16.6% |
| Scotch-Irish | 99.1 /100 | #63 | Exceptional 16.6% |
| Northern Europeans | 99.0 /100 | #64 | Exceptional 16.6% |
| Immigrants | Japan | 98.9 /100 | #65 | Exceptional 16.6% |
| Okinawans | 98.9 /100 | #66 | Exceptional 16.6% |
| Slavs | 98.7 /100 | #67 | Exceptional 16.7% |
| Chickasaw | 98.7 /100 | #68 | Exceptional 16.7% |
| Serbians | 98.7 /100 | #69 | Exceptional 16.7% |
| Austrians | 98.6 /100 | #70 | Exceptional 16.7% |
| Latvians | 98.5 /100 | #71 | Exceptional 16.7% |
| Immigrants | Canada | 98.5 /100 | #72 | Exceptional 16.7% |
| Lithuanians | 98.2 /100 | #73 | Exceptional 16.7% |
| Immigrants | Eastern Africa | 98.1 /100 | #74 | Exceptional 16.8% |
| New Zealanders | 98.0 /100 | #75 | Exceptional 16.8% |
| Immigrants | North America | 97.9 /100 | #76 | Exceptional 16.8% |
Demographics Similar to Guyanese by Unemployment Among Ages 16 to 19 years
In terms of unemployment among ages 16 to 19 years, the demographic groups most similar to Guyanese are Arapaho (25.2%, a difference of 1.3%), Kiowa (25.2%, a difference of 1.5%), Paiute (24.4%, a difference of 1.9%), Immigrants from Guyana (25.5%, a difference of 2.6%), and Immigrants from Barbados (24.0%, a difference of 3.4%).
| Demographics | Rating | Rank | Unemployment Among Ages 16 to 19 years |
| Pima | 0.0 /100 | #327 | Tragic 23.1% |
| Immigrants | Dominican Republic | 0.0 /100 | #328 | Tragic 23.3% |
| Tlingit-Haida | 0.0 /100 | #329 | Tragic 23.5% |
| Dominicans | 0.0 /100 | #330 | Tragic 23.6% |
| British West Indians | 0.0 /100 | #331 | Tragic 24.0% |
| Immigrants | Barbados | 0.0 /100 | #332 | Tragic 24.0% |
| Paiute | 0.0 /100 | #333 | Tragic 24.4% |
| Guyanese | 0.0 /100 | #334 | Tragic 24.8% |
| Arapaho | 0.0 /100 | #335 | Tragic 25.2% |
| Kiowa | 0.0 /100 | #336 | Tragic 25.2% |
| Immigrants | Guyana | 0.0 /100 | #337 | Tragic 25.5% |
| Immigrants | St. Vincent and the Grenadines | 0.0 /100 | #338 | Tragic 25.7% |
| Immigrants | Grenada | 0.0 /100 | #339 | Tragic 25.7% |
| Crow | 0.0 /100 | #340 | Tragic 26.2% |
| Puerto Ricans | 0.0 /100 | #341 | Tragic 27.5% |