Serbian vs Austrian Unemployment Among Ages 30 to 34 years
COMPARE
Serbian
Austrian
Unemployment Among Ages 30 to 34 years
Unemployment Among Ages 30 to 34 years Comparison
Serbians
Austrians
5.4%
UNEMPLOYMENT AMONG AGES 30 TO 34 YEARS
72.9/ 100
METRIC RATING
138th/ 347
METRIC RANK
5.4%
UNEMPLOYMENT AMONG AGES 30 TO 34 YEARS
59.0/ 100
METRIC RATING
161st/ 347
METRIC RANK
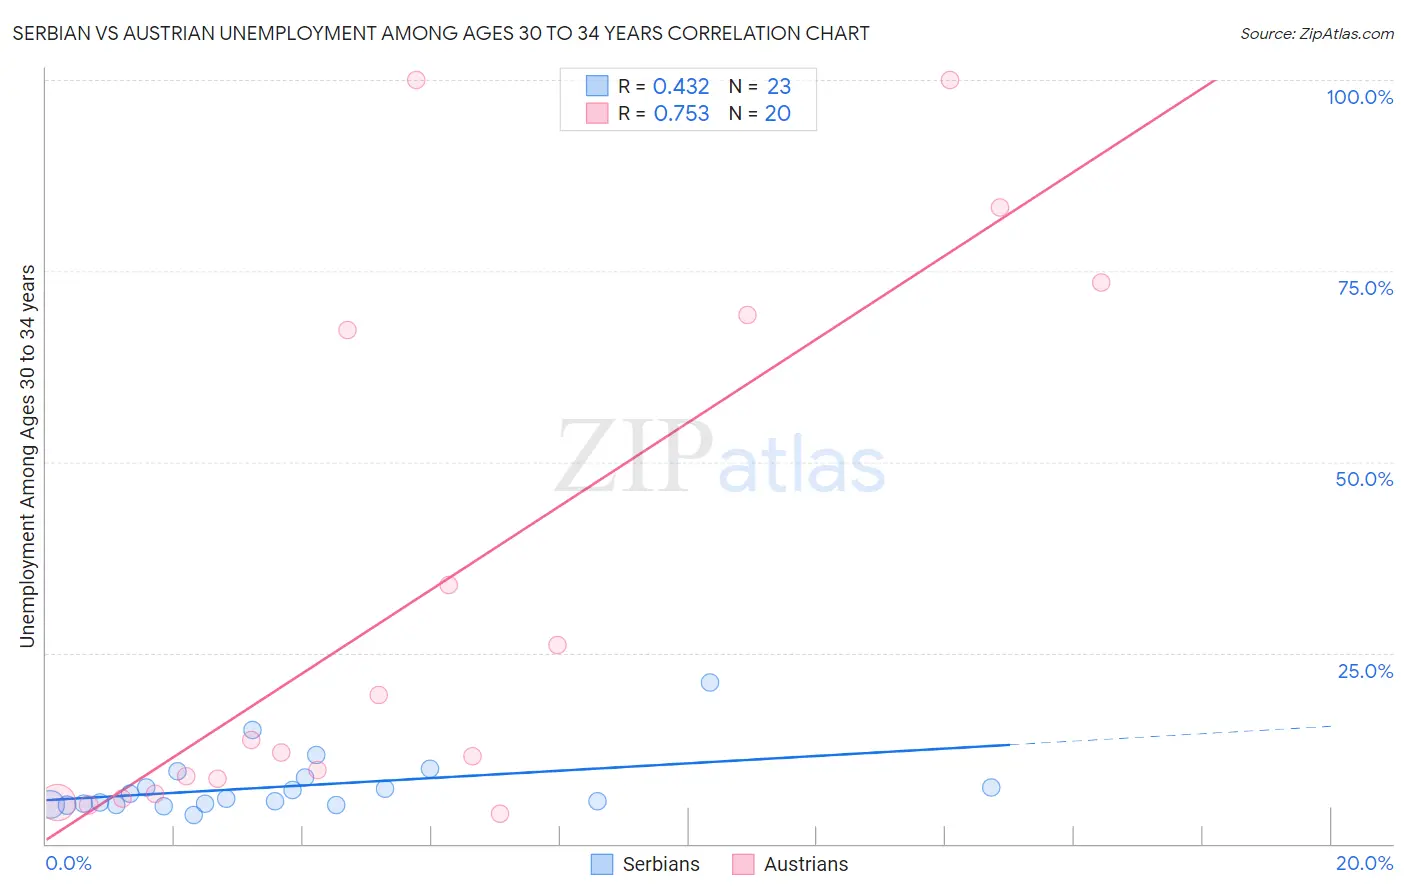
Serbian vs Austrian Unemployment Among Ages 30 to 34 years Correlation Chart
The statistical analysis conducted on geographies consisting of 254,966,443 people shows a moderate positive correlation between the proportion of Serbians and unemployment rate among population between the ages 30 and 34 in the United States with a correlation coefficient (R) of 0.432 and weighted average of 5.4%. Similarly, the statistical analysis conducted on geographies consisting of 414,053,097 people shows a strong positive correlation between the proportion of Austrians and unemployment rate among population between the ages 30 and 34 in the United States with a correlation coefficient (R) of 0.753 and weighted average of 5.4%, a difference of 1.1%.
Unemployment Among Ages 30 to 34 years Correlation Summary
| Measurement | Serbian | Austrian |
| Minimum | 3.8% | 3.9% |
| Maximum | 21.1% | 100.0% |
| Range | 17.3% | 96.1% |
| Mean | 7.5% | 33.2% |
| Median | 5.9% | 12.8% |
| Interquartile 25% (IQ1) | 5.2% | 7.5% |
| Interquartile 75% (IQ3) | 8.6% | 68.2% |
| Interquartile Range (IQR) | 3.5% | 60.7% |
| Standard Deviation (Sample) | 3.9% | 34.6% |
| Standard Deviation (Population) | 3.8% | 33.7% |
Similar Demographics by Unemployment Among Ages 30 to 34 years
Demographics Similar to Serbians by Unemployment Among Ages 30 to 34 years
In terms of unemployment among ages 30 to 34 years, the demographic groups most similar to Serbians are Lithuanian (5.4%, a difference of 0.050%), Immigrants from North America (5.4%, a difference of 0.060%), Immigrants from Europe (5.4%, a difference of 0.080%), Immigrants from Greece (5.4%, a difference of 0.080%), and Immigrants from Canada (5.4%, a difference of 0.15%).
| Demographics | Rating | Rank | Unemployment Among Ages 30 to 34 years |
| Immigrants | Eastern Europe | 77.4 /100 | #131 | Good 5.3% |
| Carpatho Rusyns | 77.3 /100 | #132 | Good 5.3% |
| Immigrants | Northern Europe | 77.3 /100 | #133 | Good 5.3% |
| Bangladeshis | 76.6 /100 | #134 | Good 5.3% |
| Palestinians | 75.1 /100 | #135 | Good 5.4% |
| Pakistanis | 74.6 /100 | #136 | Good 5.4% |
| Immigrants | Canada | 74.6 /100 | #137 | Good 5.4% |
| Serbians | 72.9 /100 | #138 | Good 5.4% |
| Lithuanians | 72.4 /100 | #139 | Good 5.4% |
| Immigrants | North America | 72.2 /100 | #140 | Good 5.4% |
| Immigrants | Europe | 72.1 /100 | #141 | Good 5.4% |
| Immigrants | Greece | 72.0 /100 | #142 | Good 5.4% |
| Russians | 71.1 /100 | #143 | Good 5.4% |
| Immigrants | Russia | 71.0 /100 | #144 | Good 5.4% |
| Syrians | 70.3 /100 | #145 | Good 5.4% |
Demographics Similar to Austrians by Unemployment Among Ages 30 to 34 years
In terms of unemployment among ages 30 to 34 years, the demographic groups most similar to Austrians are Immigrants from Scotland (5.4%, a difference of 0.020%), Brazilian (5.4%, a difference of 0.050%), Arab (5.4%, a difference of 0.090%), Basque (5.4%, a difference of 0.12%), and Immigrants from Croatia (5.4%, a difference of 0.15%).
| Demographics | Rating | Rank | Unemployment Among Ages 30 to 34 years |
| South Africans | 66.5 /100 | #154 | Good 5.4% |
| Immigrants | Hungary | 66.1 /100 | #155 | Good 5.4% |
| Czechoslovakians | 63.7 /100 | #156 | Good 5.4% |
| Albanians | 63.7 /100 | #157 | Good 5.4% |
| Immigrants | Belarus | 62.7 /100 | #158 | Good 5.4% |
| Immigrants | Croatia | 61.0 /100 | #159 | Good 5.4% |
| Immigrants | Scotland | 59.3 /100 | #160 | Average 5.4% |
| Austrians | 59.0 /100 | #161 | Average 5.4% |
| Brazilians | 58.2 /100 | #162 | Average 5.4% |
| Arabs | 57.7 /100 | #163 | Average 5.4% |
| Basques | 57.3 /100 | #164 | Average 5.4% |
| Welsh | 56.3 /100 | #165 | Average 5.4% |
| Immigrants | Thailand | 55.6 /100 | #166 | Average 5.4% |
| English | 54.8 /100 | #167 | Average 5.4% |
| South Americans | 52.9 /100 | #168 | Average 5.4% |