Senegalese vs Canadian Unemployment Among Seniors over 75 years
COMPARE
Senegalese
Canadian
Unemployment Among Seniors over 75 years
Unemployment Among Seniors over 75 years Comparison
Senegalese
Canadians
9.5%
UNEMPLOYMENT AMONG SENIORS OVER 75 YEARS
0.2/ 100
METRIC RATING
275th/ 347
METRIC RANK
9.7%
UNEMPLOYMENT AMONG SENIORS OVER 75 YEARS
0.0/ 100
METRIC RATING
288th/ 347
METRIC RANK
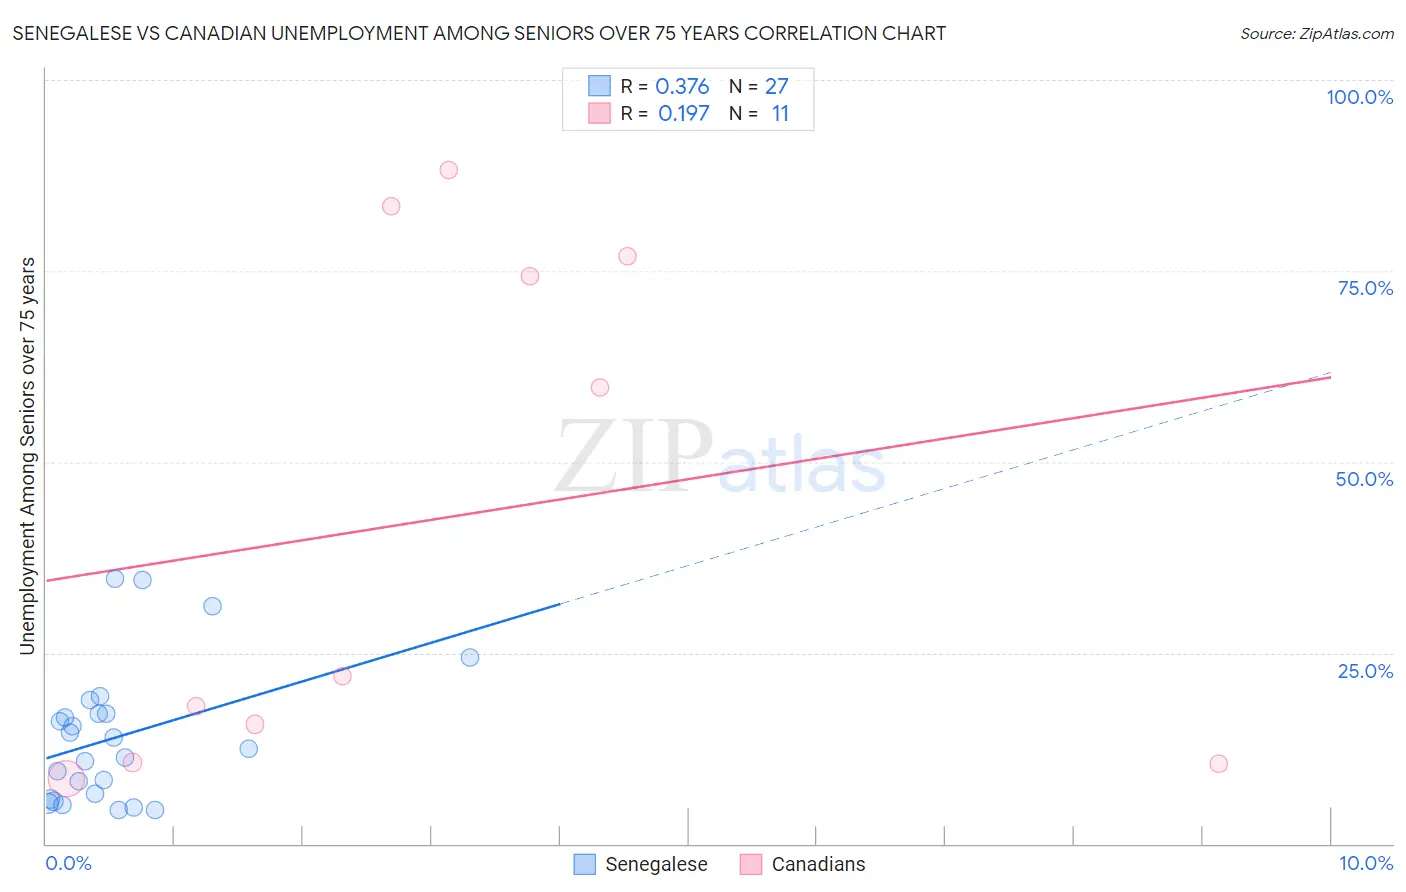
Senegalese vs Canadian Unemployment Among Seniors over 75 years Correlation Chart
The statistical analysis conducted on geographies consisting of 61,258,189 people shows a mild positive correlation between the proportion of Senegalese and unemployment rate among seniors over the age of 75 in the United States with a correlation coefficient (R) of 0.376 and weighted average of 9.5%. Similarly, the statistical analysis conducted on geographies consisting of 211,837,975 people shows a poor positive correlation between the proportion of Canadians and unemployment rate among seniors over the age of 75 in the United States with a correlation coefficient (R) of 0.197 and weighted average of 9.7%, a difference of 2.3%.
Unemployment Among Seniors over 75 years Correlation Summary
| Measurement | Senegalese | Canadian |
| Minimum | 4.4% | 8.5% |
| Maximum | 34.6% | 88.2% |
| Range | 30.2% | 79.7% |
| Mean | 13.9% | 42.5% |
| Median | 12.5% | 22.0% |
| Interquartile 25% (IQ1) | 5.9% | 10.6% |
| Interquartile 75% (IQ3) | 17.0% | 76.9% |
| Interquartile Range (IQR) | 11.1% | 66.3% |
| Standard Deviation (Sample) | 8.9% | 33.5% |
| Standard Deviation (Population) | 8.7% | 31.9% |
Demographics Similar to Senegalese and Canadians by Unemployment Among Seniors over 75 years
In terms of unemployment among seniors over 75 years, the demographic groups most similar to Senegalese are Arab (9.5%, a difference of 0.080%), Jamaican (9.5%, a difference of 0.20%), Czechoslovakian (9.4%, a difference of 0.32%), Immigrants from Iraq (9.4%, a difference of 0.47%), and Bulgarian (9.4%, a difference of 0.50%). Similarly, the demographic groups most similar to Canadians are Czech (9.7%, a difference of 0.080%), Danish (9.7%, a difference of 0.14%), Sioux (9.7%, a difference of 0.15%), Nigerian (9.7%, a difference of 0.25%), and Carpatho Rusyn (9.7%, a difference of 0.32%).
| Demographics | Rating | Rank | Unemployment Among Seniors over 75 years |
| Bulgarians | 0.3 /100 | #271 | Tragic 9.4% |
| Immigrants | Iraq | 0.3 /100 | #272 | Tragic 9.4% |
| Czechoslovakians | 0.3 /100 | #273 | Tragic 9.4% |
| Jamaicans | 0.2 /100 | #274 | Tragic 9.5% |
| Senegalese | 0.2 /100 | #275 | Tragic 9.5% |
| Arabs | 0.2 /100 | #276 | Tragic 9.5% |
| Swiss | 0.1 /100 | #277 | Tragic 9.5% |
| Immigrants | Senegal | 0.1 /100 | #278 | Tragic 9.6% |
| British | 0.1 /100 | #279 | Tragic 9.6% |
| Croatians | 0.1 /100 | #280 | Tragic 9.6% |
| Bangladeshis | 0.1 /100 | #281 | Tragic 9.6% |
| Macedonians | 0.0 /100 | #282 | Tragic 9.6% |
| Immigrants | Nigeria | 0.0 /100 | #283 | Tragic 9.6% |
| Europeans | 0.0 /100 | #284 | Tragic 9.7% |
| Carpatho Rusyns | 0.0 /100 | #285 | Tragic 9.7% |
| Nigerians | 0.0 /100 | #286 | Tragic 9.7% |
| Danes | 0.0 /100 | #287 | Tragic 9.7% |
| Canadians | 0.0 /100 | #288 | Tragic 9.7% |
| Czechs | 0.0 /100 | #289 | Tragic 9.7% |
| Sioux | 0.0 /100 | #290 | Tragic 9.7% |
| Scandinavians | 0.0 /100 | #291 | Tragic 9.7% |