Seminole vs Immigrants from Central America Male Unemployment
COMPARE
Seminole
Immigrants from Central America
Male Unemployment
Male Unemployment Comparison
Seminole
Immigrants from Central America
5.6%
MALE UNEMPLOYMENT
1.8/ 100
METRIC RATING
228th/ 347
METRIC RANK
5.8%
MALE UNEMPLOYMENT
0.1/ 100
METRIC RATING
260th/ 347
METRIC RANK
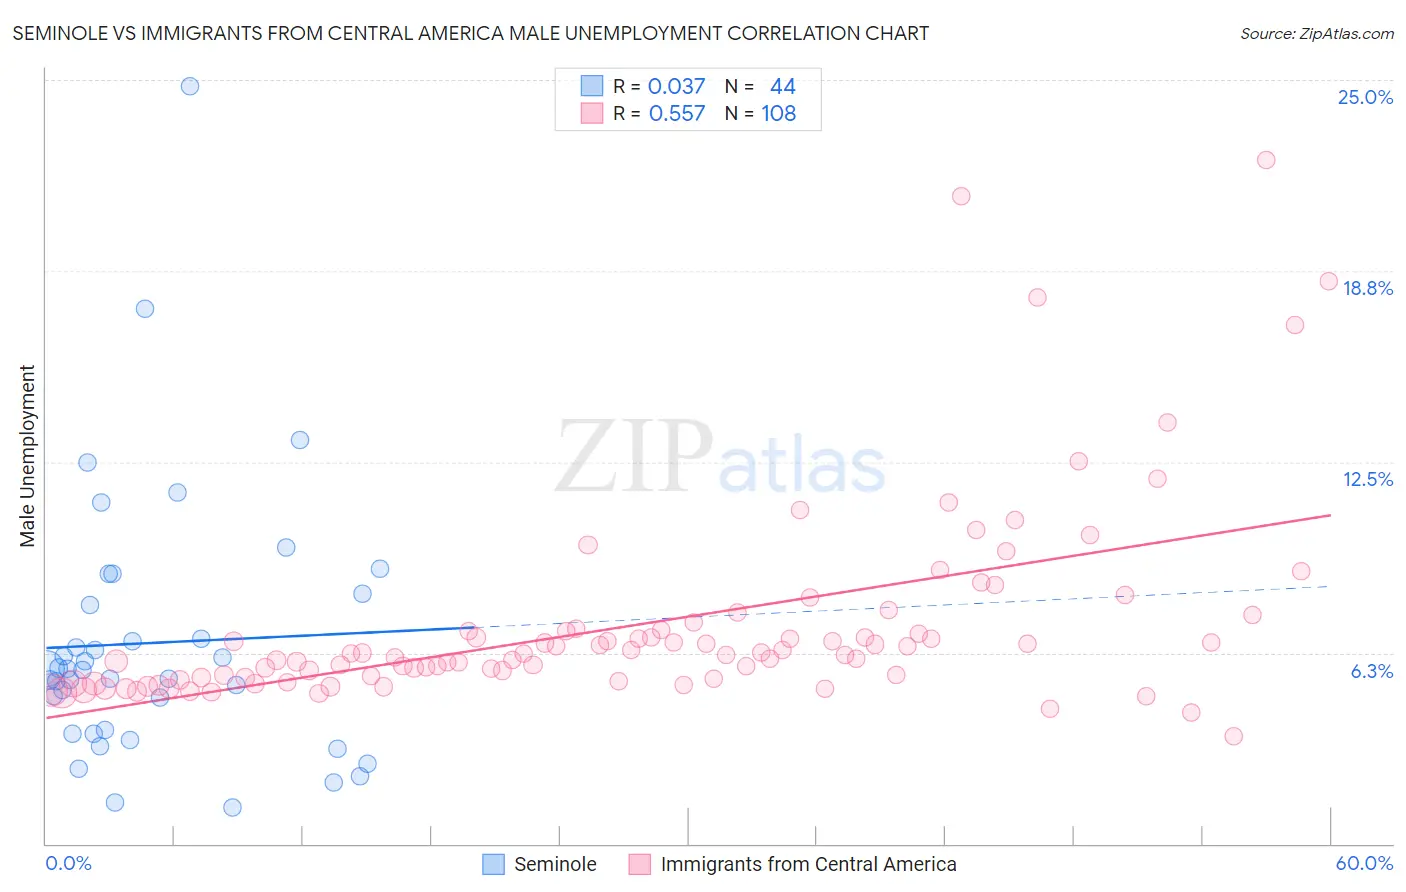
Seminole vs Immigrants from Central America Male Unemployment Correlation Chart
The statistical analysis conducted on geographies consisting of 118,187,100 people shows no correlation between the proportion of Seminole and unemployment rate among males in the United States with a correlation coefficient (R) of 0.037 and weighted average of 5.6%. Similarly, the statistical analysis conducted on geographies consisting of 529,817,546 people shows a substantial positive correlation between the proportion of Immigrants from Central America and unemployment rate among males in the United States with a correlation coefficient (R) of 0.557 and weighted average of 5.8%, a difference of 3.9%.
Male Unemployment Correlation Summary
| Measurement | Seminole | Immigrants from Central America |
| Minimum | 1.2% | 3.5% |
| Maximum | 24.8% | 22.4% |
| Range | 23.6% | 18.9% |
| Mean | 6.6% | 7.2% |
| Median | 5.7% | 6.2% |
| Interquartile 25% (IQ1) | 3.7% | 5.4% |
| Interquartile 75% (IQ3) | 8.0% | 7.0% |
| Interquartile Range (IQR) | 4.3% | 1.6% |
| Standard Deviation (Sample) | 4.4% | 3.3% |
| Standard Deviation (Population) | 4.3% | 3.2% |
Similar Demographics by Male Unemployment
Demographics Similar to Seminole by Male Unemployment
In terms of male unemployment, the demographic groups most similar to Seminole are Central American (5.6%, a difference of 0.0%), Immigrants from Cambodia (5.6%, a difference of 0.020%), Immigrants from Panama (5.6%, a difference of 0.020%), Immigrants from Africa (5.6%, a difference of 0.040%), and Choctaw (5.6%, a difference of 0.10%).
| Demographics | Rating | Rank | Male Unemployment |
| Soviet Union | 3.2 /100 | #221 | Tragic 5.6% |
| Immigrants | Micronesia | 2.9 /100 | #222 | Tragic 5.6% |
| Creek | 2.6 /100 | #223 | Tragic 5.6% |
| Cherokee | 2.4 /100 | #224 | Tragic 5.6% |
| Panamanians | 1.9 /100 | #225 | Tragic 5.6% |
| Immigrants | Cambodia | 1.8 /100 | #226 | Tragic 5.6% |
| Immigrants | Panama | 1.8 /100 | #227 | Tragic 5.6% |
| Seminole | 1.8 /100 | #228 | Tragic 5.6% |
| Central Americans | 1.8 /100 | #229 | Tragic 5.6% |
| Immigrants | Africa | 1.7 /100 | #230 | Tragic 5.6% |
| Choctaw | 1.6 /100 | #231 | Tragic 5.6% |
| Moroccans | 1.6 /100 | #232 | Tragic 5.6% |
| Somalis | 1.5 /100 | #233 | Tragic 5.6% |
| Immigrants | Somalia | 1.5 /100 | #234 | Tragic 5.6% |
| Immigrants | Honduras | 1.5 /100 | #235 | Tragic 5.6% |
Demographics Similar to Immigrants from Central America by Male Unemployment
In terms of male unemployment, the demographic groups most similar to Immigrants from Central America are Cajun (5.8%, a difference of 0.060%), Liberian (5.8%, a difference of 0.18%), Dutch West Indian (5.8%, a difference of 0.21%), Hispanic or Latino (5.8%, a difference of 0.35%), and Comanche (5.8%, a difference of 0.52%).
| Demographics | Rating | Rank | Male Unemployment |
| Mexican American Indians | 0.2 /100 | #253 | Tragic 5.8% |
| Japanese | 0.2 /100 | #254 | Tragic 5.8% |
| Kiowa | 0.2 /100 | #255 | Tragic 5.8% |
| Comanche | 0.2 /100 | #256 | Tragic 5.8% |
| Hispanics or Latinos | 0.1 /100 | #257 | Tragic 5.8% |
| Dutch West Indians | 0.1 /100 | #258 | Tragic 5.8% |
| Cajuns | 0.1 /100 | #259 | Tragic 5.8% |
| Immigrants | Central America | 0.1 /100 | #260 | Tragic 5.8% |
| Liberians | 0.1 /100 | #261 | Tragic 5.8% |
| Immigrants | Portugal | 0.1 /100 | #262 | Tragic 5.9% |
| Immigrants | Latin America | 0.1 /100 | #263 | Tragic 5.9% |
| Immigrants | Mexico | 0.0 /100 | #264 | Tragic 5.9% |
| French American Indians | 0.0 /100 | #265 | Tragic 5.9% |
| Bahamians | 0.0 /100 | #266 | Tragic 5.9% |
| Nigerians | 0.0 /100 | #267 | Tragic 5.9% |