Scottish vs Serbian Unemployment Among Women with Children Under 18 years
COMPARE
Scottish
Serbian
Unemployment Among Women with Children Under 18 years
Unemployment Among Women with Children Under 18 years Comparison
Scottish
Serbians
5.1%
UNEMPLOYMENT AMONG WOMEN WITH CHILDREN UNDER 18 YEARS
98.2/ 100
METRIC RATING
53rd/ 347
METRIC RANK
5.1%
UNEMPLOYMENT AMONG WOMEN WITH CHILDREN UNDER 18 YEARS
96.5/ 100
METRIC RATING
71st/ 347
METRIC RANK
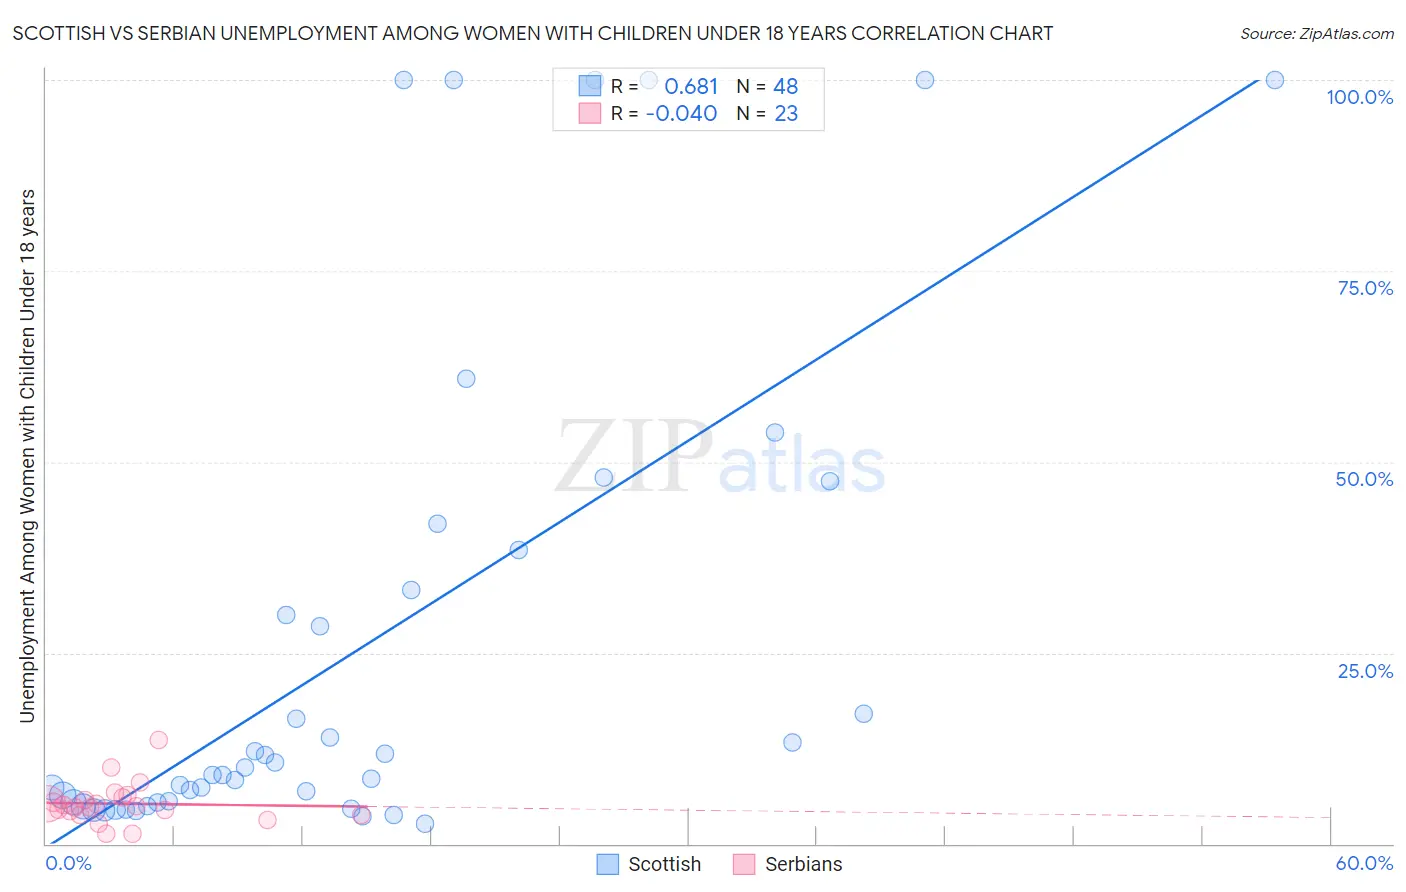
Scottish vs Serbian Unemployment Among Women with Children Under 18 years Correlation Chart
The statistical analysis conducted on geographies consisting of 511,943,552 people shows a significant positive correlation between the proportion of Scottish and unemployment rate among women with children under the age of 18 in the United States with a correlation coefficient (R) of 0.681 and weighted average of 5.1%. Similarly, the statistical analysis conducted on geographies consisting of 258,896,879 people shows no correlation between the proportion of Serbians and unemployment rate among women with children under the age of 18 in the United States with a correlation coefficient (R) of -0.040 and weighted average of 5.1%, a difference of 1.3%.
Unemployment Among Women with Children Under 18 years Correlation Summary
| Measurement | Scottish | Serbian |
| Minimum | 2.7% | 1.2% |
| Maximum | 100.0% | 13.6% |
| Range | 97.3% | 12.4% |
| Mean | 25.8% | 5.2% |
| Median | 9.4% | 4.8% |
| Interquartile 25% (IQ1) | 5.4% | 3.7% |
| Interquartile 75% (IQ3) | 35.9% | 6.0% |
| Interquartile Range (IQR) | 30.5% | 2.3% |
| Standard Deviation (Sample) | 31.9% | 2.6% |
| Standard Deviation (Population) | 31.5% | 2.6% |
Demographics Similar to Scottish and Serbians by Unemployment Among Women with Children Under 18 years
In terms of unemployment among women with children under 18 years, the demographic groups most similar to Scottish are Immigrants from Serbia (5.1%, a difference of 0.030%), Immigrants from Nepal (5.1%, a difference of 0.090%), Immigrants from Sri Lanka (5.1%, a difference of 0.16%), Immigrants from Ireland (5.1%, a difference of 0.20%), and Czechoslovakian (5.1%, a difference of 0.25%). Similarly, the demographic groups most similar to Serbians are Austrian (5.1%, a difference of 0.040%), Icelander (5.1%, a difference of 0.040%), Irish (5.1%, a difference of 0.18%), Immigrants from Bolivia (5.1%, a difference of 0.22%), and Fijian (5.1%, a difference of 0.27%).
| Demographics | Rating | Rank | Unemployment Among Women with Children Under 18 years |
| Immigrants | Nepal | 98.3 /100 | #52 | Exceptional 5.1% |
| Scottish | 98.2 /100 | #53 | Exceptional 5.1% |
| Immigrants | Serbia | 98.2 /100 | #54 | Exceptional 5.1% |
| Immigrants | Sri Lanka | 98.1 /100 | #55 | Exceptional 5.1% |
| Immigrants | Ireland | 98.0 /100 | #56 | Exceptional 5.1% |
| Czechoslovakians | 98.0 /100 | #57 | Exceptional 5.1% |
| Immigrants | Belgium | 97.9 /100 | #58 | Exceptional 5.1% |
| Asians | 97.9 /100 | #59 | Exceptional 5.1% |
| Welsh | 97.7 /100 | #60 | Exceptional 5.1% |
| Russians | 97.5 /100 | #61 | Exceptional 5.1% |
| Immigrants | Bulgaria | 97.4 /100 | #62 | Exceptional 5.1% |
| Italians | 97.4 /100 | #63 | Exceptional 5.1% |
| Estonians | 97.2 /100 | #64 | Exceptional 5.1% |
| Immigrants | Sweden | 97.1 /100 | #65 | Exceptional 5.1% |
| Immigrants | Australia | 97.0 /100 | #66 | Exceptional 5.1% |
| Fijians | 96.9 /100 | #67 | Exceptional 5.1% |
| Irish | 96.8 /100 | #68 | Exceptional 5.1% |
| Austrians | 96.6 /100 | #69 | Exceptional 5.1% |
| Icelanders | 96.6 /100 | #70 | Exceptional 5.1% |
| Serbians | 96.5 /100 | #71 | Exceptional 5.1% |
| Immigrants | Bolivia | 96.1 /100 | #72 | Exceptional 5.1% |