Scottish vs Maltese Unemployment Among Ages 35 to 44 years
COMPARE
Scottish
Maltese
Unemployment Among Ages 35 to 44 years
Unemployment Among Ages 35 to 44 years Comparison
Scottish
Maltese
4.5%
UNEMPLOYMENT AMONG AGES 35 TO 44 YEARS
93.5/ 100
METRIC RATING
96th/ 347
METRIC RANK
4.5%
UNEMPLOYMENT AMONG AGES 35 TO 44 YEARS
88.1/ 100
METRIC RATING
115th/ 347
METRIC RANK
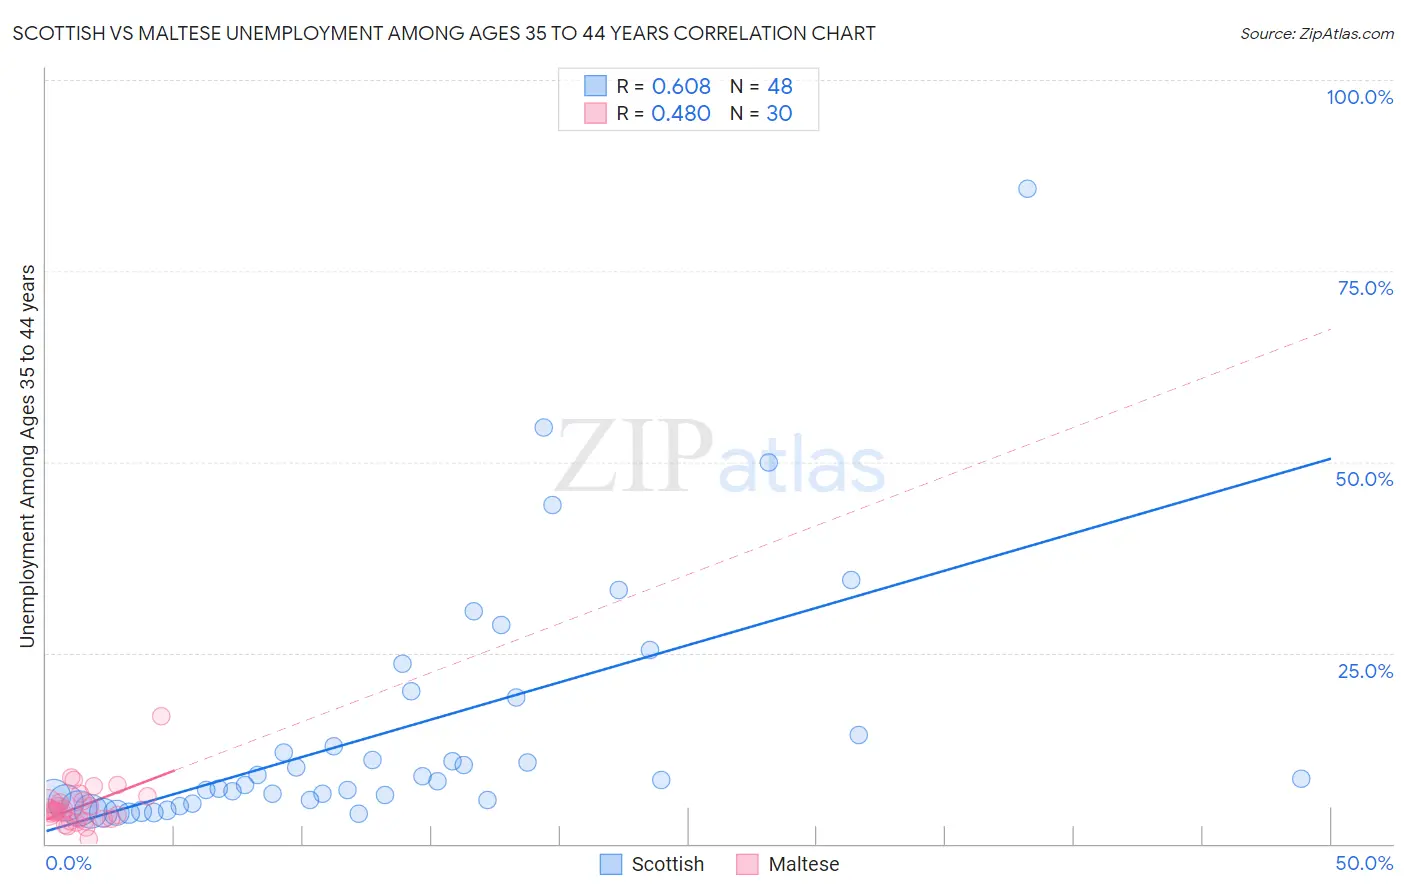
Scottish vs Maltese Unemployment Among Ages 35 to 44 years Correlation Chart
The statistical analysis conducted on geographies consisting of 527,881,435 people shows a significant positive correlation between the proportion of Scottish and unemployment rate among population between the ages 35 and 44 in the United States with a correlation coefficient (R) of 0.608 and weighted average of 4.5%. Similarly, the statistical analysis conducted on geographies consisting of 125,326,495 people shows a moderate positive correlation between the proportion of Maltese and unemployment rate among population between the ages 35 and 44 in the United States with a correlation coefficient (R) of 0.480 and weighted average of 4.5%, a difference of 1.2%.
Unemployment Among Ages 35 to 44 years Correlation Summary
| Measurement | Scottish | Maltese |
| Minimum | 3.9% | 0.60% |
| Maximum | 85.7% | 16.7% |
| Range | 81.8% | 16.1% |
| Mean | 14.8% | 4.9% |
| Median | 8.3% | 4.3% |
| Interquartile 25% (IQ1) | 5.5% | 3.2% |
| Interquartile 75% (IQ3) | 16.7% | 5.5% |
| Interquartile Range (IQR) | 11.2% | 2.3% |
| Standard Deviation (Sample) | 16.3% | 2.9% |
| Standard Deviation (Population) | 16.1% | 2.9% |
Demographics Similar to Scottish and Maltese by Unemployment Among Ages 35 to 44 years
In terms of unemployment among ages 35 to 44 years, the demographic groups most similar to Scottish are Yugoslavian (4.5%, a difference of 0.040%), Immigrants from France (4.5%, a difference of 0.29%), Immigrants from Canada (4.5%, a difference of 0.34%), Immigrants from Egypt (4.5%, a difference of 0.35%), and Italian (4.5%, a difference of 0.44%). Similarly, the demographic groups most similar to Maltese are Macedonian (4.5%, a difference of 0.030%), Immigrants from Italy (4.5%, a difference of 0.050%), Immigrants from Czechoslovakia (4.5%, a difference of 0.19%), Immigrants from Nicaragua (4.5%, a difference of 0.32%), and Immigrants from Kazakhstan (4.5%, a difference of 0.35%).
| Demographics | Rating | Rank | Unemployment Among Ages 35 to 44 years |
| Yugoslavians | 93.6 /100 | #95 | Exceptional 4.5% |
| Scottish | 93.5 /100 | #96 | Exceptional 4.5% |
| Immigrants | France | 92.5 /100 | #97 | Exceptional 4.5% |
| Immigrants | Canada | 92.3 /100 | #98 | Exceptional 4.5% |
| Immigrants | Egypt | 92.3 /100 | #99 | Exceptional 4.5% |
| Italians | 91.9 /100 | #100 | Exceptional 4.5% |
| Immigrants | Netherlands | 91.9 /100 | #101 | Exceptional 4.5% |
| Immigrants | Sudan | 91.8 /100 | #102 | Exceptional 4.5% |
| Welsh | 91.6 /100 | #103 | Exceptional 4.5% |
| Finns | 91.6 /100 | #104 | Exceptional 4.5% |
| Immigrants | Saudi Arabia | 91.3 /100 | #105 | Exceptional 4.5% |
| Immigrants | North America | 91.1 /100 | #106 | Exceptional 4.5% |
| Immigrants | North Macedonia | 90.7 /100 | #107 | Exceptional 4.5% |
| New Zealanders | 90.3 /100 | #108 | Exceptional 4.5% |
| Romanians | 90.3 /100 | #109 | Exceptional 4.5% |
| Immigrants | Kazakhstan | 90.0 /100 | #110 | Excellent 4.5% |
| Immigrants | Nicaragua | 89.8 /100 | #111 | Excellent 4.5% |
| Immigrants | Czechoslovakia | 89.2 /100 | #112 | Excellent 4.5% |
| Immigrants | Italy | 88.4 /100 | #113 | Excellent 4.5% |
| Macedonians | 88.3 /100 | #114 | Excellent 4.5% |
| Maltese | 88.1 /100 | #115 | Excellent 4.5% |