Samoan vs Immigrants from Israel Unemployment Among Ages 30 to 34 years
COMPARE
Samoan
Immigrants from Israel
Unemployment Among Ages 30 to 34 years
Unemployment Among Ages 30 to 34 years Comparison
Samoans
Immigrants from Israel
5.8%
UNEMPLOYMENT AMONG AGES 30 TO 34 YEARS
2.5/ 100
METRIC RATING
225th/ 347
METRIC RANK
5.4%
UNEMPLOYMENT AMONG AGES 30 TO 34 YEARS
52.9/ 100
METRIC RATING
169th/ 347
METRIC RANK
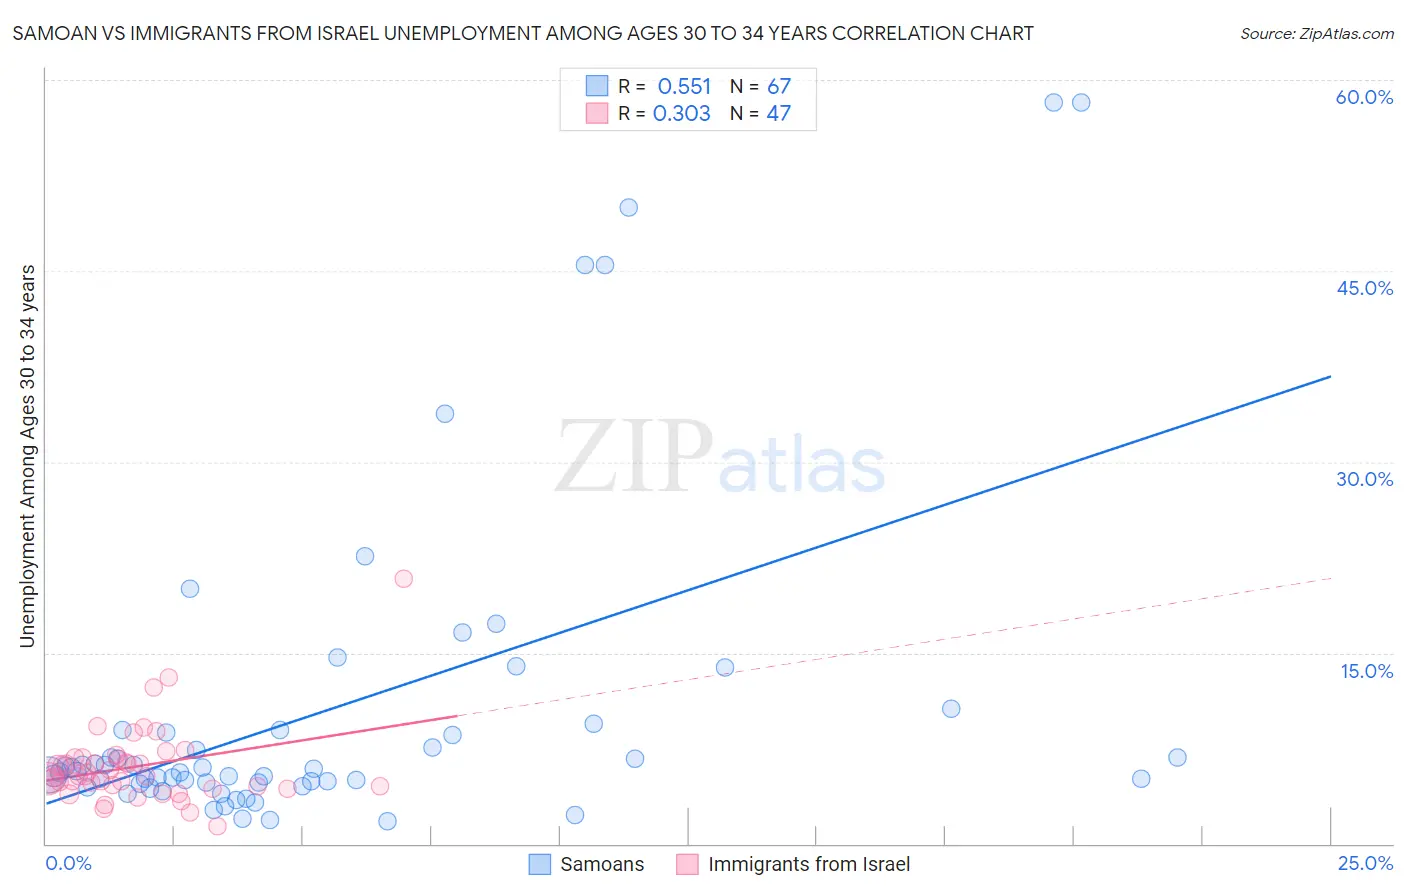
Samoan vs Immigrants from Israel Unemployment Among Ages 30 to 34 years Correlation Chart
The statistical analysis conducted on geographies consisting of 218,774,829 people shows a substantial positive correlation between the proportion of Samoans and unemployment rate among population between the ages 30 and 34 in the United States with a correlation coefficient (R) of 0.551 and weighted average of 5.8%. Similarly, the statistical analysis conducted on geographies consisting of 203,511,406 people shows a mild positive correlation between the proportion of Immigrants from Israel and unemployment rate among population between the ages 30 and 34 in the United States with a correlation coefficient (R) of 0.303 and weighted average of 5.4%, a difference of 6.6%.
Unemployment Among Ages 30 to 34 years Correlation Summary
| Measurement | Samoan | Immigrants from Israel |
| Minimum | 1.8% | 1.4% |
| Maximum | 58.2% | 20.8% |
| Range | 56.4% | 19.4% |
| Mean | 10.5% | 6.1% |
| Median | 5.7% | 5.3% |
| Interquartile 25% (IQ1) | 4.8% | 4.5% |
| Interquartile 75% (IQ3) | 8.9% | 6.8% |
| Interquartile Range (IQR) | 4.1% | 2.3% |
| Standard Deviation (Sample) | 12.9% | 3.1% |
| Standard Deviation (Population) | 12.8% | 3.1% |
Similar Demographics by Unemployment Among Ages 30 to 34 years
Demographics Similar to Samoans by Unemployment Among Ages 30 to 34 years
In terms of unemployment among ages 30 to 34 years, the demographic groups most similar to Samoans are Slovak (5.8%, a difference of 0.030%), Liberian (5.8%, a difference of 0.13%), Bermudan (5.8%, a difference of 0.17%), Spaniard (5.8%, a difference of 0.44%), and Spanish (5.8%, a difference of 0.47%).
| Demographics | Rating | Rank | Unemployment Among Ages 30 to 34 years |
| Panamanians | 4.5 /100 | #218 | Tragic 5.8% |
| French Canadians | 4.4 /100 | #219 | Tragic 5.8% |
| Sierra Leoneans | 3.9 /100 | #220 | Tragic 5.8% |
| Guamanians/Chamorros | 3.9 /100 | #221 | Tragic 5.8% |
| Spaniards | 3.2 /100 | #222 | Tragic 5.8% |
| Bermudans | 2.7 /100 | #223 | Tragic 5.8% |
| Slovaks | 2.5 /100 | #224 | Tragic 5.8% |
| Samoans | 2.5 /100 | #225 | Tragic 5.8% |
| Liberians | 2.3 /100 | #226 | Tragic 5.8% |
| Spanish | 1.8 /100 | #227 | Tragic 5.8% |
| Immigrants | Bahamas | 1.8 /100 | #228 | Tragic 5.8% |
| Immigrants | Uzbekistan | 1.5 /100 | #229 | Tragic 5.9% |
| Hawaiians | 1.2 /100 | #230 | Tragic 5.9% |
| Japanese | 1.1 /100 | #231 | Tragic 5.9% |
| Iroquois | 1.0 /100 | #232 | Tragic 5.9% |
Demographics Similar to Immigrants from Israel by Unemployment Among Ages 30 to 34 years
In terms of unemployment among ages 30 to 34 years, the demographic groups most similar to Immigrants from Israel are South American (5.4%, a difference of 0.010%), Dutch (5.5%, a difference of 0.020%), Scottish (5.5%, a difference of 0.070%), Immigrants from Austria (5.5%, a difference of 0.11%), and English (5.4%, a difference of 0.14%).
| Demographics | Rating | Rank | Unemployment Among Ages 30 to 34 years |
| Brazilians | 58.2 /100 | #162 | Average 5.4% |
| Arabs | 57.7 /100 | #163 | Average 5.4% |
| Basques | 57.3 /100 | #164 | Average 5.4% |
| Welsh | 56.3 /100 | #165 | Average 5.4% |
| Immigrants | Thailand | 55.6 /100 | #166 | Average 5.4% |
| English | 54.8 /100 | #167 | Average 5.4% |
| South Americans | 52.9 /100 | #168 | Average 5.4% |
| Immigrants | Israel | 52.9 /100 | #169 | Average 5.4% |
| Dutch | 52.6 /100 | #170 | Average 5.5% |
| Scottish | 51.8 /100 | #171 | Average 5.5% |
| Immigrants | Austria | 51.3 /100 | #172 | Average 5.5% |
| Peruvians | 50.2 /100 | #173 | Average 5.5% |
| Immigrants | Laos | 50.0 /100 | #174 | Average 5.5% |
| Afghans | 49.6 /100 | #175 | Average 5.5% |
| Immigrants | Peru | 48.0 /100 | #176 | Average 5.5% |