Samoan vs Bolivian Unemployment Among Ages 60 to 64 years
COMPARE
Samoan
Bolivian
Unemployment Among Ages 60 to 64 years
Unemployment Among Ages 60 to 64 years Comparison
Samoans
Bolivians
4.9%
UNEMPLOYMENT AMONG AGES 60 TO 64 YEARS
53.6/ 100
METRIC RATING
171st/ 347
METRIC RANK
4.8%
UNEMPLOYMENT AMONG AGES 60 TO 64 YEARS
75.5/ 100
METRIC RATING
153rd/ 347
METRIC RANK
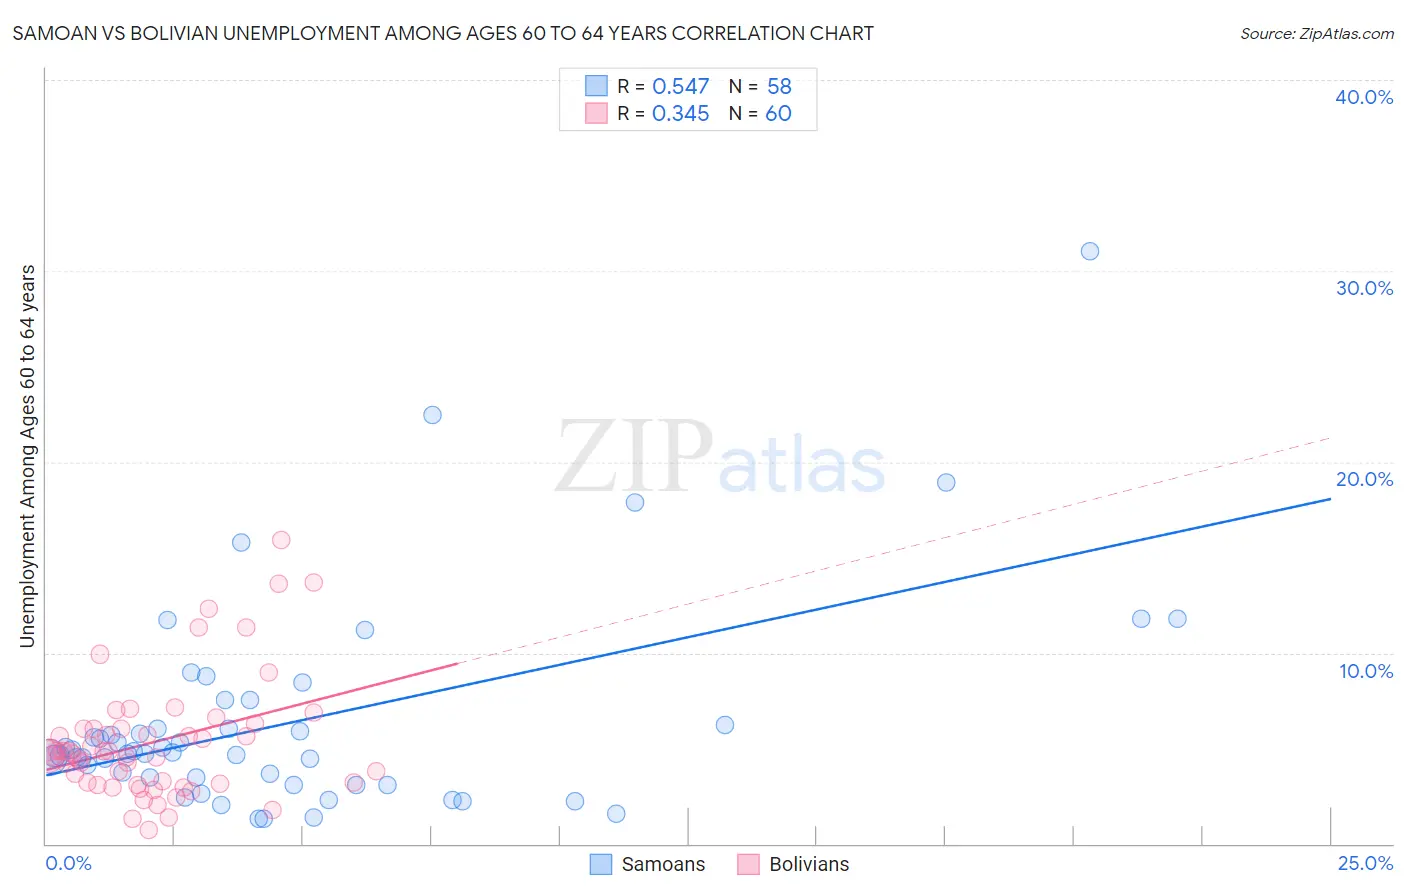
Samoan vs Bolivian Unemployment Among Ages 60 to 64 years Correlation Chart
The statistical analysis conducted on geographies consisting of 211,154,134 people shows a substantial positive correlation between the proportion of Samoans and unemployment rate among population between the ages 60 and 64 in the United States with a correlation coefficient (R) of 0.547 and weighted average of 4.9%. Similarly, the statistical analysis conducted on geographies consisting of 176,427,539 people shows a mild positive correlation between the proportion of Bolivians and unemployment rate among population between the ages 60 and 64 in the United States with a correlation coefficient (R) of 0.345 and weighted average of 4.8%, a difference of 0.88%.
Unemployment Among Ages 60 to 64 years Correlation Summary
| Measurement | Samoan | Bolivian |
| Minimum | 1.3% | 0.70% |
| Maximum | 31.0% | 15.9% |
| Range | 29.7% | 15.2% |
| Mean | 6.4% | 5.3% |
| Median | 4.8% | 4.8% |
| Interquartile 25% (IQ1) | 3.4% | 3.2% |
| Interquartile 75% (IQ3) | 6.2% | 6.0% |
| Interquartile Range (IQR) | 2.8% | 2.8% |
| Standard Deviation (Sample) | 5.5% | 3.2% |
| Standard Deviation (Population) | 5.4% | 3.1% |
Demographics Similar to Samoans and Bolivians by Unemployment Among Ages 60 to 64 years
In terms of unemployment among ages 60 to 64 years, the demographic groups most similar to Samoans are Immigrants from Korea (4.8%, a difference of 0.020%), Immigrants from Turkey (4.9%, a difference of 0.030%), Immigrants from France (4.8%, a difference of 0.070%), Immigrants from Southern Europe (4.8%, a difference of 0.11%), and Immigrants from Northern Europe (4.8%, a difference of 0.20%). Similarly, the demographic groups most similar to Bolivians are American (4.8%, a difference of 0.010%), Chilean (4.8%, a difference of 0.13%), Filipino (4.8%, a difference of 0.16%), Immigrants from Bolivia (4.8%, a difference of 0.28%), and Laotian (4.8%, a difference of 0.38%).
| Demographics | Rating | Rank | Unemployment Among Ages 60 to 64 years |
| Americans | 75.7 /100 | #152 | Good 4.8% |
| Bolivians | 75.5 /100 | #153 | Good 4.8% |
| Chileans | 72.6 /100 | #154 | Good 4.8% |
| Filipinos | 72.1 /100 | #155 | Good 4.8% |
| Immigrants | Bolivia | 69.2 /100 | #156 | Good 4.8% |
| Laotians | 66.8 /100 | #157 | Good 4.8% |
| Immigrants | Taiwan | 66.0 /100 | #158 | Good 4.8% |
| Spanish | 65.5 /100 | #159 | Good 4.8% |
| Australians | 65.3 /100 | #160 | Good 4.8% |
| Immigrants | Norway | 65.1 /100 | #161 | Good 4.8% |
| South Africans | 65.1 /100 | #162 | Good 4.8% |
| Immigrants | Belgium | 64.8 /100 | #163 | Good 4.8% |
| Pakistanis | 64.6 /100 | #164 | Good 4.8% |
| Immigrants | Panama | 62.0 /100 | #165 | Good 4.8% |
| Palestinians | 60.5 /100 | #166 | Good 4.8% |
| Immigrants | Northern Europe | 59.1 /100 | #167 | Average 4.8% |
| Immigrants | Southern Europe | 56.7 /100 | #168 | Average 4.8% |
| Immigrants | France | 55.5 /100 | #169 | Average 4.8% |
| Immigrants | Korea | 54.2 /100 | #170 | Average 4.8% |
| Samoans | 53.6 /100 | #171 | Average 4.9% |
| Immigrants | Turkey | 52.8 /100 | #172 | Average 4.9% |