Salvadoran vs Yuman Unemployment Among Youth under 25 years
COMPARE
Salvadoran
Yuman
Unemployment Among Youth under 25 years
Unemployment Among Youth under 25 years Comparison
Salvadorans
Yuman
12.4%
UNEMPLOYMENT AMONG YOUTH UNDER 25 YEARS
0.1/ 100
METRIC RATING
258th/ 347
METRIC RANK
16.3%
UNEMPLOYMENT AMONG YOUTH UNDER 25 YEARS
0.0/ 100
METRIC RATING
338th/ 347
METRIC RANK
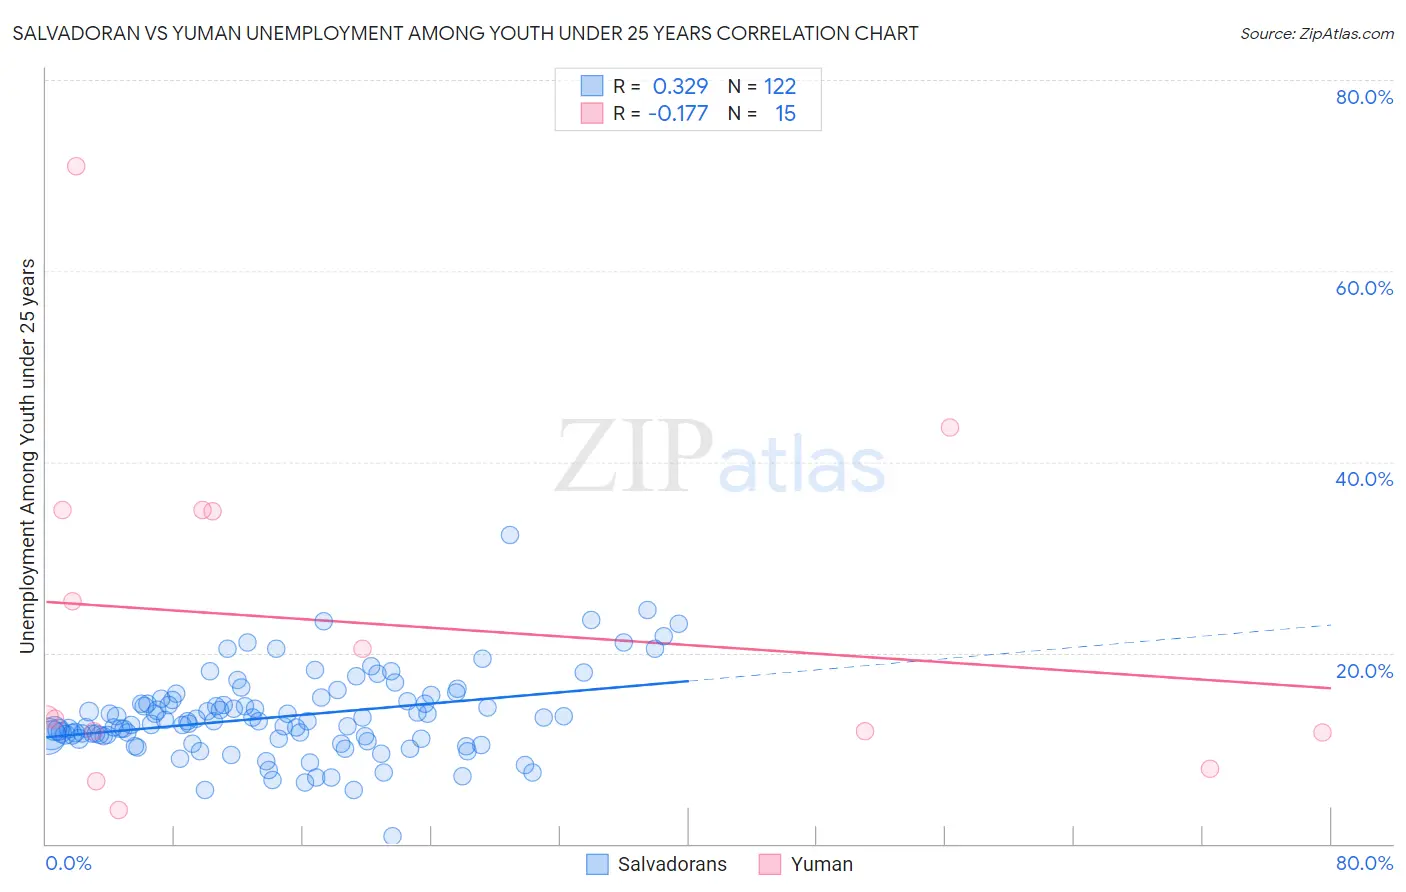
Salvadoran vs Yuman Unemployment Among Youth under 25 years Correlation Chart
The statistical analysis conducted on geographies consisting of 394,534,582 people shows a mild positive correlation between the proportion of Salvadorans and unemployment rate among youth under the age of 25 in the United States with a correlation coefficient (R) of 0.329 and weighted average of 12.4%. Similarly, the statistical analysis conducted on geographies consisting of 40,598,494 people shows a poor negative correlation between the proportion of Yuman and unemployment rate among youth under the age of 25 in the United States with a correlation coefficient (R) of -0.177 and weighted average of 16.3%, a difference of 31.8%.
Unemployment Among Youth under 25 years Correlation Summary
| Measurement | Salvadoran | Yuman |
| Minimum | 0.80% | 3.5% |
| Maximum | 32.4% | 71.0% |
| Range | 31.6% | 67.5% |
| Mean | 13.3% | 23.0% |
| Median | 12.9% | 13.2% |
| Interquartile 25% (IQ1) | 11.0% | 11.6% |
| Interquartile 75% (IQ3) | 14.9% | 34.9% |
| Interquartile Range (IQR) | 3.9% | 23.3% |
| Standard Deviation (Sample) | 4.4% | 18.2% |
| Standard Deviation (Population) | 4.4% | 17.6% |
Similar Demographics by Unemployment Among Youth under 25 years
Demographics Similar to Salvadorans by Unemployment Among Youth under 25 years
In terms of unemployment among youth under 25 years, the demographic groups most similar to Salvadorans are Panamanian (12.4%, a difference of 0.030%), Liberian (12.4%, a difference of 0.040%), Immigrants from Central America (12.4%, a difference of 0.050%), Hispanic or Latino (12.4%, a difference of 0.11%), and Immigrants from Panama (12.4%, a difference of 0.35%).
| Demographics | Rating | Rank | Unemployment Among Youth under 25 years |
| Mexican American Indians | 0.4 /100 | #251 | Tragic 12.3% |
| Immigrants | Syria | 0.3 /100 | #252 | Tragic 12.3% |
| Mexicans | 0.3 /100 | #253 | Tragic 12.3% |
| Hondurans | 0.3 /100 | #254 | Tragic 12.3% |
| Hispanics or Latinos | 0.2 /100 | #255 | Tragic 12.4% |
| Liberians | 0.2 /100 | #256 | Tragic 12.4% |
| Panamanians | 0.2 /100 | #257 | Tragic 12.4% |
| Salvadorans | 0.1 /100 | #258 | Tragic 12.4% |
| Immigrants | Central America | 0.1 /100 | #259 | Tragic 12.4% |
| Immigrants | Panama | 0.1 /100 | #260 | Tragic 12.4% |
| Immigrants | El Salvador | 0.1 /100 | #261 | Tragic 12.4% |
| Immigrants | Mexico | 0.1 /100 | #262 | Tragic 12.4% |
| Cree | 0.1 /100 | #263 | Tragic 12.4% |
| Puget Sound Salish | 0.1 /100 | #264 | Tragic 12.5% |
| Nepalese | 0.0 /100 | #265 | Tragic 12.5% |
Demographics Similar to Yuman by Unemployment Among Youth under 25 years
In terms of unemployment among youth under 25 years, the demographic groups most similar to Yuman are Arapaho (16.3%, a difference of 0.30%), Pima (16.2%, a difference of 0.45%), Tsimshian (16.5%, a difference of 1.0%), Immigrants from St. Vincent and the Grenadines (16.1%, a difference of 1.1%), and Immigrants from Guyana (15.9%, a difference of 2.4%).
| Demographics | Rating | Rank | Unemployment Among Youth under 25 years |
| Dominicans | 0.0 /100 | #331 | Tragic 15.7% |
| Immigrants | Grenada | 0.0 /100 | #332 | Tragic 15.8% |
| Guyanese | 0.0 /100 | #333 | Tragic 15.9% |
| Immigrants | Guyana | 0.0 /100 | #334 | Tragic 15.9% |
| Immigrants | St. Vincent and the Grenadines | 0.0 /100 | #335 | Tragic 16.1% |
| Pima | 0.0 /100 | #336 | Tragic 16.2% |
| Arapaho | 0.0 /100 | #337 | Tragic 16.3% |
| Yuman | 0.0 /100 | #338 | Tragic 16.3% |
| Tsimshian | 0.0 /100 | #339 | Tragic 16.5% |
| Colville | 0.0 /100 | #340 | Tragic 16.8% |
| Paiute | 0.0 /100 | #341 | Tragic 17.6% |
| Puerto Ricans | 0.0 /100 | #342 | Tragic 18.4% |
| Navajo | 0.0 /100 | #343 | Tragic 18.6% |
| Crow | 0.0 /100 | #344 | Tragic 20.1% |
| Hopi | 0.0 /100 | #345 | Tragic 21.5% |