Salvadoran vs Iranian Unemployment Among Ages 16 to 19 years
COMPARE
Salvadoran
Iranian
Unemployment Among Ages 16 to 19 years
Unemployment Among Ages 16 to 19 years Comparison
Salvadorans
Iranians
18.9%
UNEMPLOYMENT AMONG AGES 16 TO 19 YEARS
0.1/ 100
METRIC RATING
262nd/ 347
METRIC RANK
17.0%
UNEMPLOYMENT AMONG AGES 16 TO 19 YEARS
94.1/ 100
METRIC RATING
109th/ 347
METRIC RANK
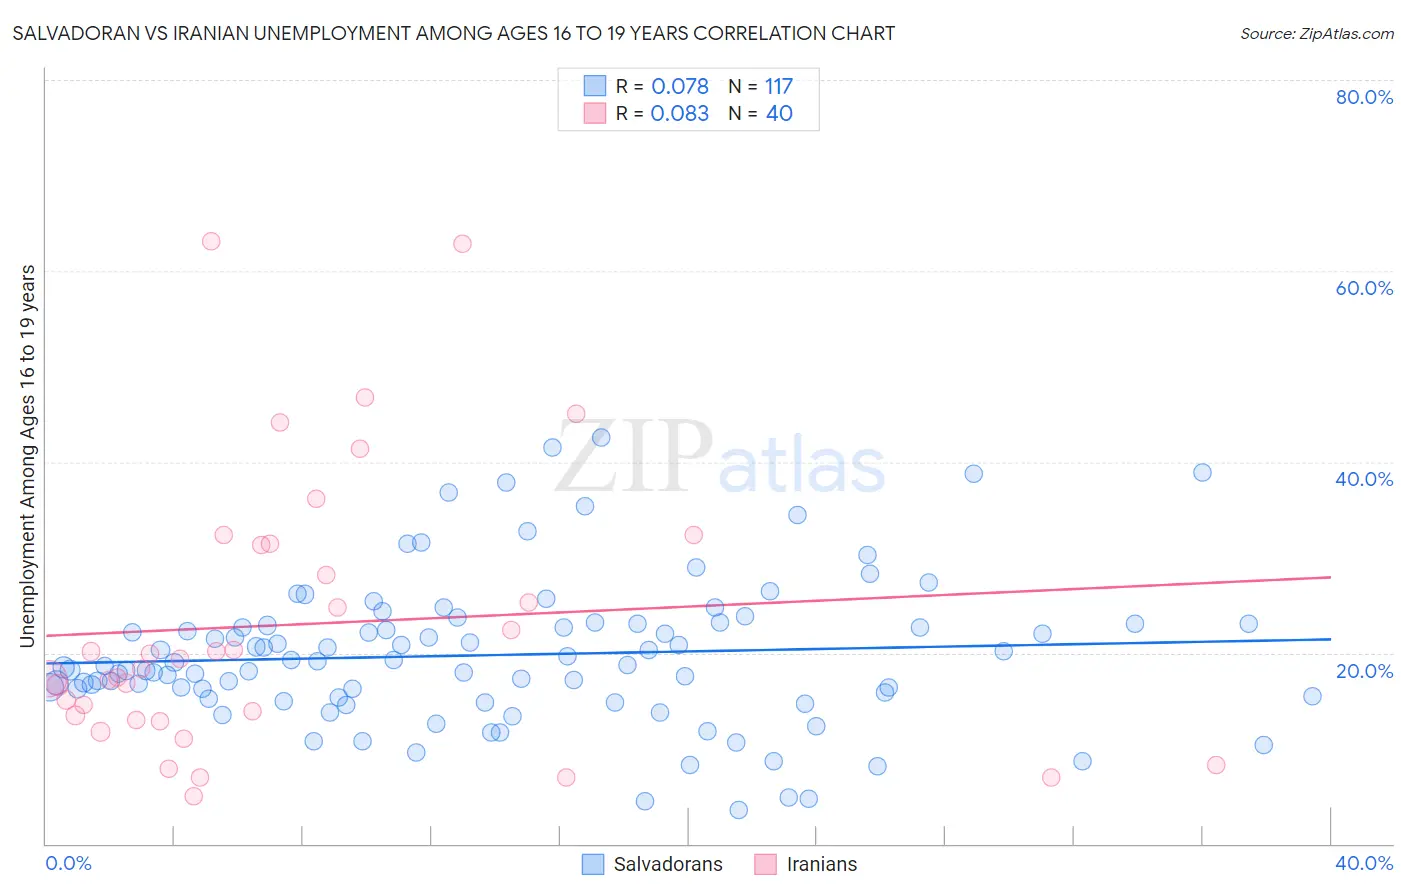
Salvadoran vs Iranian Unemployment Among Ages 16 to 19 years Correlation Chart
The statistical analysis conducted on geographies consisting of 380,157,558 people shows a slight positive correlation between the proportion of Salvadorans and unemployment rate among population between the ages 16 and 19 in the United States with a correlation coefficient (R) of 0.078 and weighted average of 18.9%. Similarly, the statistical analysis conducted on geographies consisting of 304,193,106 people shows a slight positive correlation between the proportion of Iranians and unemployment rate among population between the ages 16 and 19 in the United States with a correlation coefficient (R) of 0.083 and weighted average of 17.0%, a difference of 11.4%.
Unemployment Among Ages 16 to 19 years Correlation Summary
| Measurement | Salvadoran | Iranian |
| Minimum | 3.6% | 5.0% |
| Maximum | 42.5% | 63.1% |
| Range | 38.9% | 58.2% |
| Mean | 19.8% | 22.9% |
| Median | 18.7% | 18.8% |
| Interquartile 25% (IQ1) | 15.4% | 13.2% |
| Interquartile 75% (IQ3) | 23.1% | 31.3% |
| Interquartile Range (IQR) | 7.7% | 18.1% |
| Standard Deviation (Sample) | 7.6% | 14.4% |
| Standard Deviation (Population) | 7.6% | 14.3% |
Similar Demographics by Unemployment Among Ages 16 to 19 years
Demographics Similar to Salvadorans by Unemployment Among Ages 16 to 19 years
In terms of unemployment among ages 16 to 19 years, the demographic groups most similar to Salvadorans are Spanish American Indian (18.9%, a difference of 0.040%), Nigerian (18.9%, a difference of 0.080%), Cree (19.0%, a difference of 0.13%), Immigrants from Central America (18.9%, a difference of 0.16%), and Yaqui (19.0%, a difference of 0.16%).
| Demographics | Rating | Rank | Unemployment Among Ages 16 to 19 years |
| Immigrants | Cameroon | 0.3 /100 | #255 | Tragic 18.8% |
| Mexican American Indians | 0.3 /100 | #256 | Tragic 18.8% |
| Immigrants | Nigeria | 0.2 /100 | #257 | Tragic 18.9% |
| Immigrants | Mexico | 0.2 /100 | #258 | Tragic 18.9% |
| Immigrants | Central America | 0.2 /100 | #259 | Tragic 18.9% |
| Nigerians | 0.2 /100 | #260 | Tragic 18.9% |
| Spanish American Indians | 0.1 /100 | #261 | Tragic 18.9% |
| Salvadorans | 0.1 /100 | #262 | Tragic 18.9% |
| Cree | 0.1 /100 | #263 | Tragic 19.0% |
| Yaqui | 0.1 /100 | #264 | Tragic 19.0% |
| Choctaw | 0.1 /100 | #265 | Tragic 19.0% |
| Immigrants | Honduras | 0.1 /100 | #266 | Tragic 19.0% |
| Israelis | 0.1 /100 | #267 | Tragic 19.0% |
| Immigrants | El Salvador | 0.1 /100 | #268 | Tragic 19.1% |
| Lumbee | 0.1 /100 | #269 | Tragic 19.1% |
Demographics Similar to Iranians by Unemployment Among Ages 16 to 19 years
In terms of unemployment among ages 16 to 19 years, the demographic groups most similar to Iranians are Immigrants from Brazil (17.0%, a difference of 0.020%), Malaysian (17.0%, a difference of 0.020%), Immigrants from Netherlands (17.0%, a difference of 0.040%), Immigrants from Bulgaria (17.0%, a difference of 0.050%), and Estonian (17.0%, a difference of 0.050%).
| Demographics | Rating | Rank | Unemployment Among Ages 16 to 19 years |
| Immigrants | Pakistan | 94.6 /100 | #102 | Exceptional 17.0% |
| Palestinians | 94.6 /100 | #103 | Exceptional 17.0% |
| Italians | 94.5 /100 | #104 | Exceptional 17.0% |
| Immigrants | Bulgaria | 94.3 /100 | #105 | Exceptional 17.0% |
| Estonians | 94.3 /100 | #106 | Exceptional 17.0% |
| Immigrants | Brazil | 94.2 /100 | #107 | Exceptional 17.0% |
| Malaysians | 94.2 /100 | #108 | Exceptional 17.0% |
| Iranians | 94.1 /100 | #109 | Exceptional 17.0% |
| Immigrants | Netherlands | 93.9 /100 | #110 | Exceptional 17.0% |
| Immigrants | Asia | 93.9 /100 | #111 | Exceptional 17.0% |
| Immigrants | Iraq | 93.7 /100 | #112 | Exceptional 17.0% |
| Icelanders | 93.4 /100 | #113 | Exceptional 17.0% |
| Immigrants | Poland | 93.1 /100 | #114 | Exceptional 17.0% |
| Brazilians | 92.3 /100 | #115 | Exceptional 17.1% |
| Immigrants | Korea | 92.2 /100 | #116 | Exceptional 17.1% |