Salvadoran vs Immigrants from South Central Asia Unemployment Among Women with Children Under 6 years
COMPARE
Salvadoran
Immigrants from South Central Asia
Unemployment Among Women with Children Under 6 years
Unemployment Among Women with Children Under 6 years Comparison
Salvadorans
Immigrants from South Central Asia
8.0%
UNEMPLOYMENT AMONG WOMEN WITH CHILDREN UNDER 6 YEARS
5.5/ 100
METRIC RATING
229th/ 347
METRIC RANK
6.6%
UNEMPLOYMENT AMONG WOMEN WITH CHILDREN UNDER 6 YEARS
100.0/ 100
METRIC RATING
34th/ 347
METRIC RANK
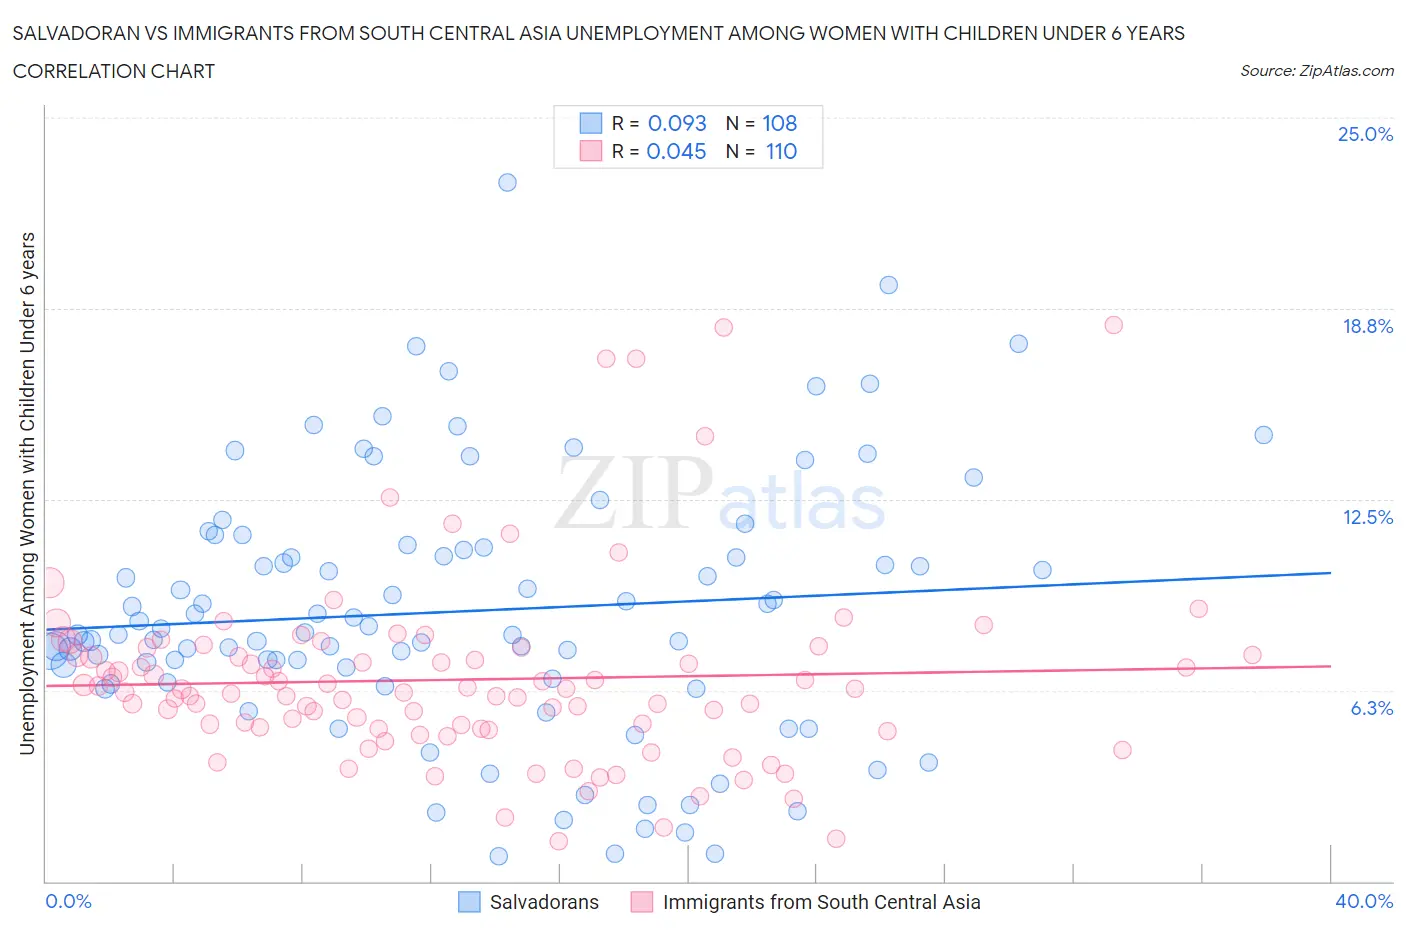
Salvadoran vs Immigrants from South Central Asia Unemployment Among Women with Children Under 6 years Correlation Chart
The statistical analysis conducted on geographies consisting of 311,506,560 people shows a slight positive correlation between the proportion of Salvadorans and unemployment rate among women with children under the age of 6 in the United States with a correlation coefficient (R) of 0.093 and weighted average of 8.0%. Similarly, the statistical analysis conducted on geographies consisting of 345,035,256 people shows no correlation between the proportion of Immigrants from South Central Asia and unemployment rate among women with children under the age of 6 in the United States with a correlation coefficient (R) of 0.045 and weighted average of 6.6%, a difference of 21.1%.
Unemployment Among Women with Children Under 6 years Correlation Summary
| Measurement | Salvadoran | Immigrants from South Central Asia |
| Minimum | 0.80% | 1.3% |
| Maximum | 22.9% | 18.2% |
| Range | 22.1% | 16.9% |
| Mean | 8.8% | 6.6% |
| Median | 8.1% | 6.2% |
| Interquartile 25% (IQ1) | 6.6% | 5.0% |
| Interquartile 75% (IQ3) | 10.9% | 7.4% |
| Interquartile Range (IQR) | 4.3% | 2.4% |
| Standard Deviation (Sample) | 4.2% | 3.1% |
| Standard Deviation (Population) | 4.2% | 3.0% |
Similar Demographics by Unemployment Among Women with Children Under 6 years
Demographics Similar to Salvadorans by Unemployment Among Women with Children Under 6 years
In terms of unemployment among women with children under 6 years, the demographic groups most similar to Salvadorans are Finnish (8.0%, a difference of 0.070%), Trinidadian and Tobagonian (8.0%, a difference of 0.070%), Immigrants from Sudan (8.0%, a difference of 0.15%), Welsh (8.0%, a difference of 0.16%), and Portuguese (8.0%, a difference of 0.18%).
| Demographics | Rating | Rank | Unemployment Among Women with Children Under 6 years |
| Samoans | 8.4 /100 | #222 | Tragic 7.9% |
| Carpatho Rusyns | 7.8 /100 | #223 | Tragic 8.0% |
| English | 7.2 /100 | #224 | Tragic 8.0% |
| Germans | 7.0 /100 | #225 | Tragic 8.0% |
| Senegalese | 6.2 /100 | #226 | Tragic 8.0% |
| Portuguese | 6.2 /100 | #227 | Tragic 8.0% |
| Immigrants | Sudan | 6.0 /100 | #228 | Tragic 8.0% |
| Salvadorans | 5.5 /100 | #229 | Tragic 8.0% |
| Finns | 5.3 /100 | #230 | Tragic 8.0% |
| Trinidadians and Tobagonians | 5.3 /100 | #231 | Tragic 8.0% |
| Welsh | 5.0 /100 | #232 | Tragic 8.0% |
| Immigrants | Trinidad and Tobago | 4.8 /100 | #233 | Tragic 8.0% |
| Kiowa | 4.4 /100 | #234 | Tragic 8.0% |
| Comanche | 4.3 /100 | #235 | Tragic 8.0% |
| Immigrants | Barbados | 4.2 /100 | #236 | Tragic 8.0% |
Demographics Similar to Immigrants from South Central Asia by Unemployment Among Women with Children Under 6 years
In terms of unemployment among women with children under 6 years, the demographic groups most similar to Immigrants from South Central Asia are Immigrants from Vietnam (6.6%, a difference of 0.010%), Tsimshian (6.6%, a difference of 0.030%), Immigrants from Moldova (6.6%, a difference of 0.090%), Yakama (6.6%, a difference of 0.27%), and Luxembourger (6.6%, a difference of 0.34%).
| Demographics | Rating | Rank | Unemployment Among Women with Children Under 6 years |
| Immigrants | Japan | 100.0 /100 | #27 | Exceptional 6.5% |
| Immigrants | Israel | 100.0 /100 | #28 | Exceptional 6.5% |
| Immigrants | Sweden | 100.0 /100 | #29 | Exceptional 6.6% |
| Immigrants | Belarus | 100.0 /100 | #30 | Exceptional 6.6% |
| Immigrants | Moldova | 100.0 /100 | #31 | Exceptional 6.6% |
| Tsimshian | 100.0 /100 | #32 | Exceptional 6.6% |
| Immigrants | Vietnam | 100.0 /100 | #33 | Exceptional 6.6% |
| Immigrants | South Central Asia | 100.0 /100 | #34 | Exceptional 6.6% |
| Yakama | 100.0 /100 | #35 | Exceptional 6.6% |
| Luxembourgers | 100.0 /100 | #36 | Exceptional 6.6% |
| Sri Lankans | 100.0 /100 | #37 | Exceptional 6.6% |
| Hmong | 100.0 /100 | #38 | Exceptional 6.7% |
| Immigrants | Russia | 100.0 /100 | #39 | Exceptional 6.7% |
| Asians | 100.0 /100 | #40 | Exceptional 6.7% |
| Immigrants | Indonesia | 99.9 /100 | #41 | Exceptional 6.7% |