Salvadoran vs Immigrants from Denmark Unemployment Among Ages 65 to 74 years
COMPARE
Salvadoran
Immigrants from Denmark
Unemployment Among Ages 65 to 74 years
Unemployment Among Ages 65 to 74 years Comparison
Salvadorans
Immigrants from Denmark
5.8%
UNEMPLOYMENT AMONG AGES 65 TO 74 YEARS
0.0/ 100
METRIC RATING
304th/ 347
METRIC RANK
5.4%
UNEMPLOYMENT AMONG AGES 65 TO 74 YEARS
24.7/ 100
METRIC RATING
194th/ 347
METRIC RANK
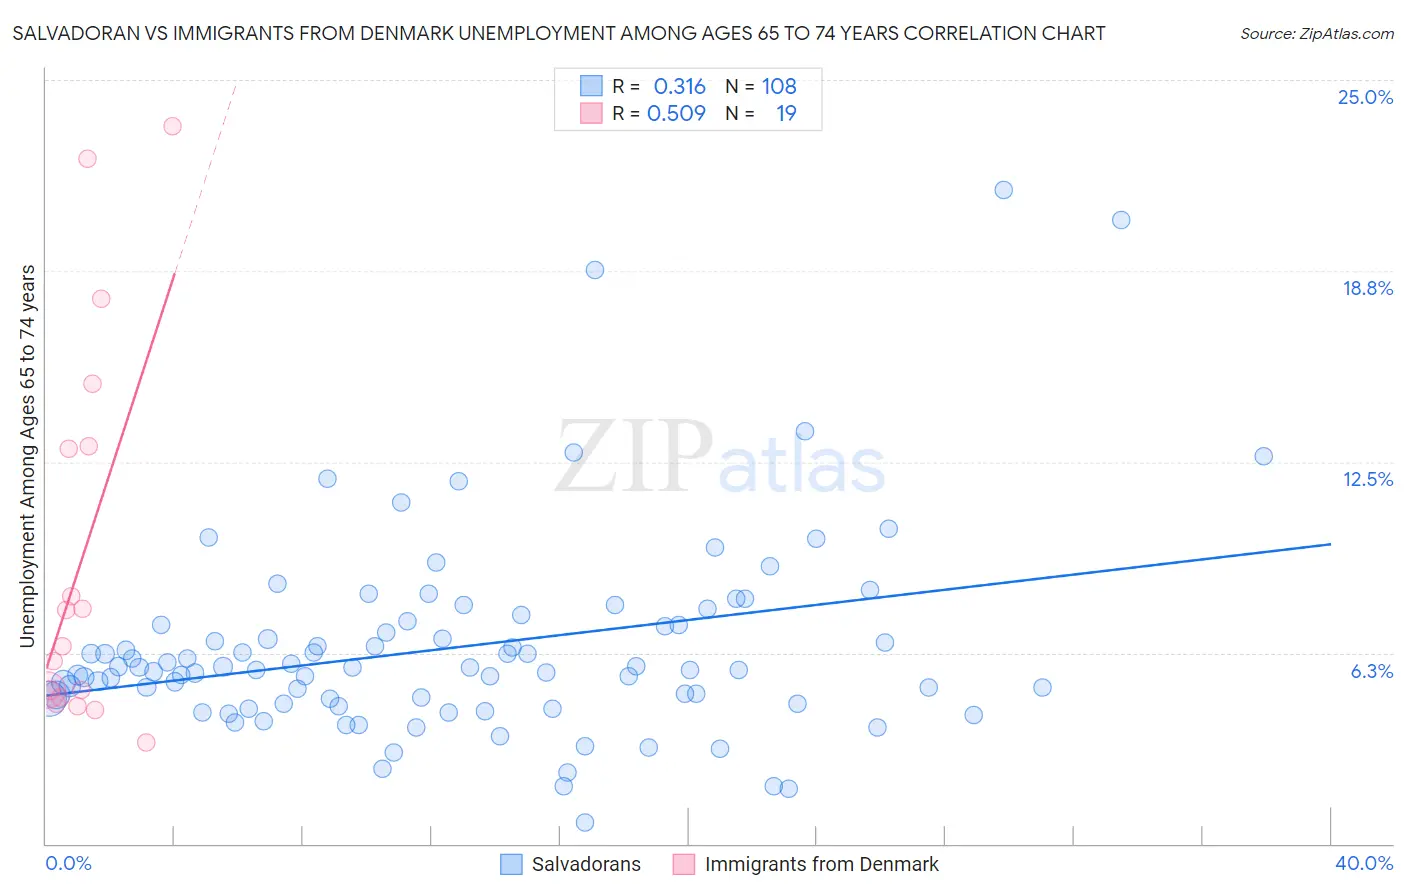
Salvadoran vs Immigrants from Denmark Unemployment Among Ages 65 to 74 years Correlation Chart
The statistical analysis conducted on geographies consisting of 350,281,293 people shows a mild positive correlation between the proportion of Salvadorans and unemployment rate among population between the ages 65 and 74 in the United States with a correlation coefficient (R) of 0.316 and weighted average of 5.8%. Similarly, the statistical analysis conducted on geographies consisting of 129,223,730 people shows a substantial positive correlation between the proportion of Immigrants from Denmark and unemployment rate among population between the ages 65 and 74 in the United States with a correlation coefficient (R) of 0.509 and weighted average of 5.4%, a difference of 7.7%.
Unemployment Among Ages 65 to 74 years Correlation Summary
| Measurement | Salvadoran | Immigrants from Denmark |
| Minimum | 0.70% | 3.3% |
| Maximum | 21.4% | 23.5% |
| Range | 20.7% | 20.2% |
| Mean | 6.4% | 9.3% |
| Median | 5.7% | 6.5% |
| Interquartile 25% (IQ1) | 4.7% | 4.8% |
| Interquartile 75% (IQ3) | 7.2% | 13.0% |
| Interquartile Range (IQR) | 2.5% | 8.2% |
| Standard Deviation (Sample) | 3.3% | 6.3% |
| Standard Deviation (Population) | 3.3% | 6.1% |
Similar Demographics by Unemployment Among Ages 65 to 74 years
Demographics Similar to Salvadorans by Unemployment Among Ages 65 to 74 years
In terms of unemployment among ages 65 to 74 years, the demographic groups most similar to Salvadorans are Arapaho (5.8%, a difference of 0.0%), Mexican (5.8%, a difference of 0.010%), Cheyenne (5.8%, a difference of 0.010%), British West Indian (5.8%, a difference of 0.020%), and Liberian (5.8%, a difference of 0.030%).
| Demographics | Rating | Rank | Unemployment Among Ages 65 to 74 years |
| Houma | 0.0 /100 | #297 | Tragic 5.8% |
| Immigrants | Latin America | 0.0 /100 | #298 | Tragic 5.8% |
| Barbadians | 0.0 /100 | #299 | Tragic 5.8% |
| Ecuadorians | 0.0 /100 | #300 | Tragic 5.8% |
| Armenians | 0.0 /100 | #301 | Tragic 5.8% |
| Liberians | 0.0 /100 | #302 | Tragic 5.8% |
| Arapaho | 0.0 /100 | #303 | Tragic 5.8% |
| Salvadorans | 0.0 /100 | #304 | Tragic 5.8% |
| Mexicans | 0.0 /100 | #305 | Tragic 5.8% |
| Cheyenne | 0.0 /100 | #306 | Tragic 5.8% |
| British West Indians | 0.0 /100 | #307 | Tragic 5.8% |
| Guatemalans | 0.0 /100 | #308 | Tragic 5.8% |
| Immigrants | Ecuador | 0.0 /100 | #309 | Tragic 5.8% |
| Immigrants | Bangladesh | 0.0 /100 | #310 | Tragic 5.9% |
| Venezuelans | 0.0 /100 | #311 | Tragic 5.9% |
Demographics Similar to Immigrants from Denmark by Unemployment Among Ages 65 to 74 years
In terms of unemployment among ages 65 to 74 years, the demographic groups most similar to Immigrants from Denmark are Immigrants from China (5.4%, a difference of 0.020%), Cherokee (5.4%, a difference of 0.050%), Basque (5.4%, a difference of 0.080%), Immigrants from Egypt (5.4%, a difference of 0.080%), and Maltese (5.4%, a difference of 0.080%).
| Demographics | Rating | Rank | Unemployment Among Ages 65 to 74 years |
| Immigrants | Nonimmigrants | 30.6 /100 | #187 | Fair 5.4% |
| Immigrants | Europe | 28.8 /100 | #188 | Fair 5.4% |
| Immigrants | Africa | 28.3 /100 | #189 | Fair 5.4% |
| Basques | 26.6 /100 | #190 | Fair 5.4% |
| Immigrants | Egypt | 26.5 /100 | #191 | Fair 5.4% |
| Maltese | 26.4 /100 | #192 | Fair 5.4% |
| Cherokee | 25.8 /100 | #193 | Fair 5.4% |
| Immigrants | Denmark | 24.7 /100 | #194 | Fair 5.4% |
| Immigrants | China | 24.2 /100 | #195 | Fair 5.4% |
| Costa Ricans | 21.1 /100 | #196 | Fair 5.4% |
| Colville | 20.4 /100 | #197 | Fair 5.4% |
| Albanians | 17.8 /100 | #198 | Poor 5.4% |
| Immigrants | Belgium | 16.2 /100 | #199 | Poor 5.4% |
| Immigrants | Pakistan | 15.2 /100 | #200 | Poor 5.4% |
| Immigrants | Western Asia | 14.9 /100 | #201 | Poor 5.4% |