Russian vs Immigrants from Turkey Unemployment Among Ages 45 to 54 years
COMPARE
Russian
Immigrants from Turkey
Unemployment Among Ages 45 to 54 years
Unemployment Among Ages 45 to 54 years Comparison
Russians
Immigrants from Turkey
4.4%
UNEMPLOYMENT AMONG AGES 45 TO 54 YEARS
92.1/ 100
METRIC RATING
108th/ 347
METRIC RANK
4.3%
UNEMPLOYMENT AMONG AGES 45 TO 54 YEARS
96.9/ 100
METRIC RATING
88th/ 347
METRIC RANK
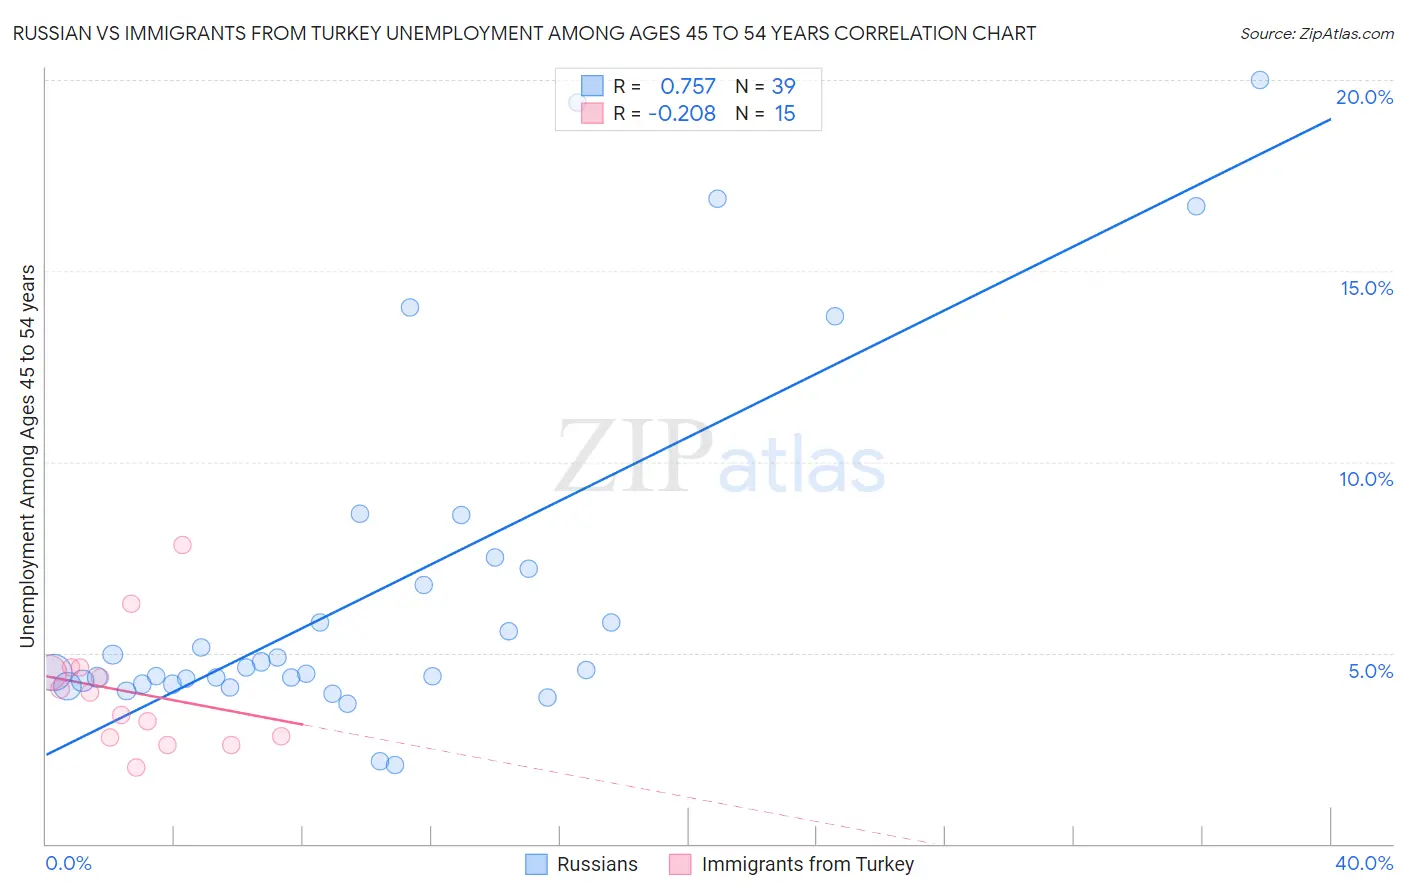
Russian vs Immigrants from Turkey Unemployment Among Ages 45 to 54 years Correlation Chart
The statistical analysis conducted on geographies consisting of 486,020,320 people shows a strong positive correlation between the proportion of Russians and unemployment rate among population between the ages 45 and 54 in the United States with a correlation coefficient (R) of 0.757 and weighted average of 4.4%. Similarly, the statistical analysis conducted on geographies consisting of 220,555,131 people shows a weak negative correlation between the proportion of Immigrants from Turkey and unemployment rate among population between the ages 45 and 54 in the United States with a correlation coefficient (R) of -0.208 and weighted average of 4.3%, a difference of 1.2%.
Unemployment Among Ages 45 to 54 years Correlation Summary
| Measurement | Russian | Immigrants from Turkey |
| Minimum | 2.1% | 2.0% |
| Maximum | 20.0% | 7.8% |
| Range | 17.9% | 5.8% |
| Mean | 6.7% | 4.0% |
| Median | 4.6% | 4.0% |
| Interquartile 25% (IQ1) | 4.2% | 2.8% |
| Interquartile 75% (IQ3) | 7.2% | 4.6% |
| Interquartile Range (IQR) | 3.0% | 1.8% |
| Standard Deviation (Sample) | 4.7% | 1.5% |
| Standard Deviation (Population) | 4.6% | 1.5% |
Demographics Similar to Russians and Immigrants from Turkey by Unemployment Among Ages 45 to 54 years
In terms of unemployment among ages 45 to 54 years, the demographic groups most similar to Russians are Iranian (4.4%, a difference of 0.060%), Immigrants from South Africa (4.4%, a difference of 0.060%), Immigrants from Kenya (4.4%, a difference of 0.12%), Immigrants from Sweden (4.4%, a difference of 0.15%), and Icelander (4.4%, a difference of 0.25%). Similarly, the demographic groups most similar to Immigrants from Turkey are Immigrants from Argentina (4.3%, a difference of 0.0%), Asian (4.3%, a difference of 0.060%), Ukrainian (4.3%, a difference of 0.12%), Mongolian (4.3%, a difference of 0.15%), and Argentinean (4.3%, a difference of 0.16%).
| Demographics | Rating | Rank | Unemployment Among Ages 45 to 54 years |
| Immigrants | Turkey | 96.9 /100 | #88 | Exceptional 4.3% |
| Immigrants | Argentina | 96.9 /100 | #89 | Exceptional 4.3% |
| Asians | 96.8 /100 | #90 | Exceptional 4.3% |
| Ukrainians | 96.6 /100 | #91 | Exceptional 4.3% |
| Mongolians | 96.6 /100 | #92 | Exceptional 4.3% |
| Argentineans | 96.5 /100 | #93 | Exceptional 4.3% |
| Immigrants | Malaysia | 96.2 /100 | #94 | Exceptional 4.4% |
| Immigrants | Ethiopia | 96.1 /100 | #95 | Exceptional 4.4% |
| Indonesians | 95.4 /100 | #96 | Exceptional 4.4% |
| Immigrants | Canada | 95.0 /100 | #97 | Exceptional 4.4% |
| Romanians | 94.9 /100 | #98 | Exceptional 4.4% |
| Immigrants | Burma/Myanmar | 94.9 /100 | #99 | Exceptional 4.4% |
| Immigrants | Eritrea | 94.7 /100 | #100 | Exceptional 4.4% |
| Immigrants | North America | 93.9 /100 | #101 | Exceptional 4.4% |
| Sri Lankans | 93.7 /100 | #102 | Exceptional 4.4% |
| Icelanders | 93.5 /100 | #103 | Exceptional 4.4% |
| Immigrants | Sweden | 93.0 /100 | #104 | Exceptional 4.4% |
| Immigrants | Kenya | 92.8 /100 | #105 | Exceptional 4.4% |
| Iranians | 92.5 /100 | #106 | Exceptional 4.4% |
| Immigrants | South Africa | 92.5 /100 | #107 | Exceptional 4.4% |
| Russians | 92.1 /100 | #108 | Exceptional 4.4% |