Romanian vs Finnish Unemployment Among Seniors over 75 years
COMPARE
Romanian
Finnish
Unemployment Among Seniors over 75 years
Unemployment Among Seniors over 75 years Comparison
Romanians
Finns
9.0%
UNEMPLOYMENT AMONG SENIORS OVER 75 YEARS
13.8/ 100
METRIC RATING
212th/ 347
METRIC RANK
10.0%
UNEMPLOYMENT AMONG SENIORS OVER 75 YEARS
0.0/ 100
METRIC RATING
302nd/ 347
METRIC RANK
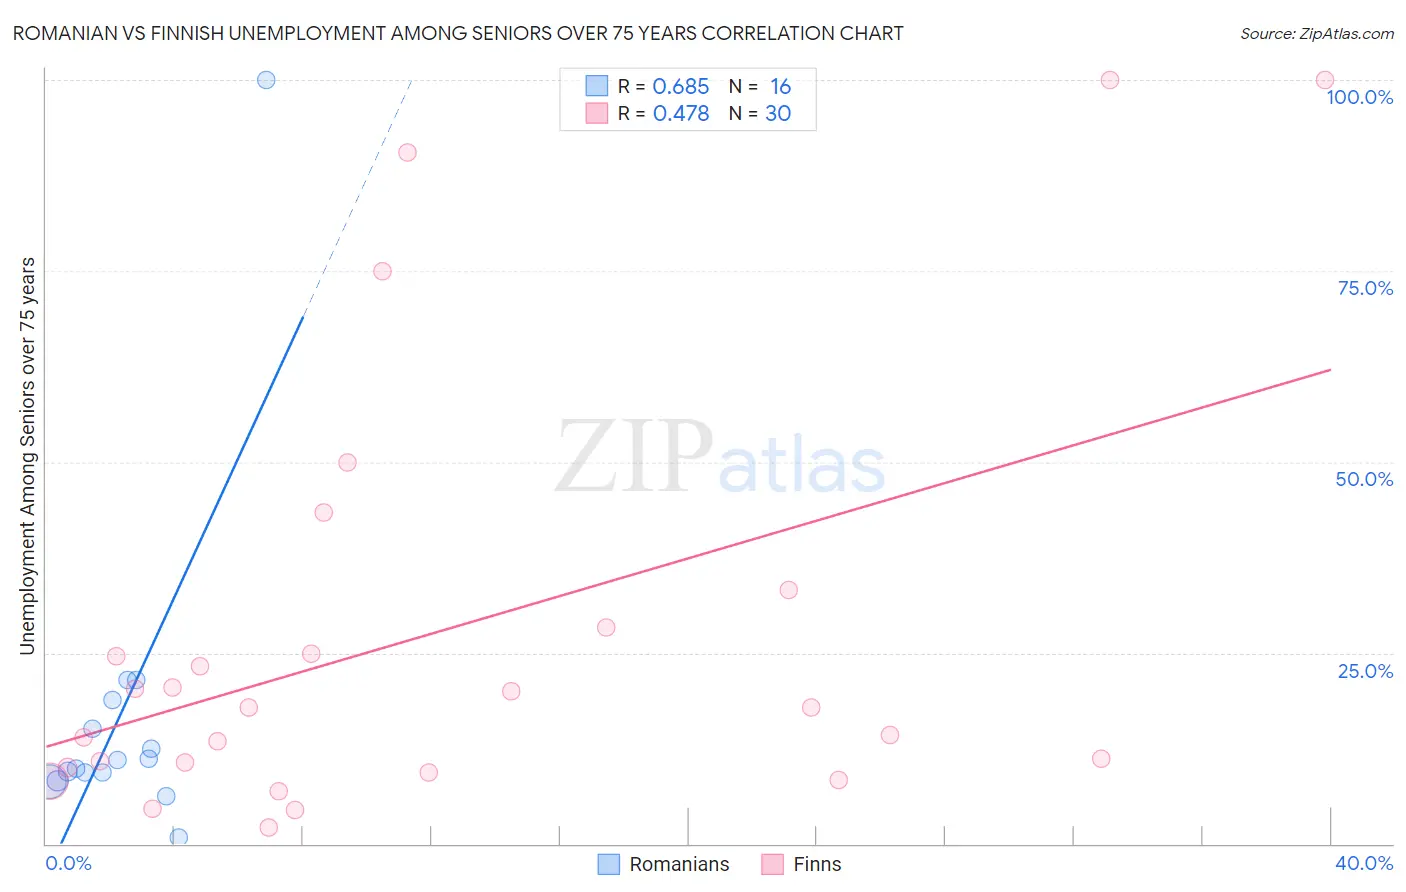
Romanian vs Finnish Unemployment Among Seniors over 75 years Correlation Chart
The statistical analysis conducted on geographies consisting of 198,082,720 people shows a significant positive correlation between the proportion of Romanians and unemployment rate among seniors over the age of 75 in the United States with a correlation coefficient (R) of 0.685 and weighted average of 9.0%. Similarly, the statistical analysis conducted on geographies consisting of 198,752,301 people shows a moderate positive correlation between the proportion of Finns and unemployment rate among seniors over the age of 75 in the United States with a correlation coefficient (R) of 0.478 and weighted average of 10.0%, a difference of 11.2%.
Unemployment Among Seniors over 75 years Correlation Summary
| Measurement | Romanian | Finnish |
| Minimum | 0.90% | 2.1% |
| Maximum | 100.0% | 100.0% |
| Range | 99.1% | 97.9% |
| Mean | 17.0% | 27.3% |
| Median | 10.4% | 17.9% |
| Interquartile 25% (IQ1) | 8.8% | 10.0% |
| Interquartile 75% (IQ3) | 16.9% | 28.3% |
| Interquartile Range (IQR) | 8.2% | 18.2% |
| Standard Deviation (Sample) | 22.8% | 28.0% |
| Standard Deviation (Population) | 22.1% | 27.6% |
Similar Demographics by Unemployment Among Seniors over 75 years
Demographics Similar to Romanians by Unemployment Among Seniors over 75 years
In terms of unemployment among seniors over 75 years, the demographic groups most similar to Romanians are Immigrants from Latin America (9.0%, a difference of 0.040%), Immigrants from Brazil (9.0%, a difference of 0.050%), Delaware (9.0%, a difference of 0.080%), Bermudan (8.9%, a difference of 0.13%), and Immigrants from Western Asia (9.0%, a difference of 0.15%).
| Demographics | Rating | Rank | Unemployment Among Seniors over 75 years |
| Koreans | 21.9 /100 | #205 | Fair 8.9% |
| Immigrants | Western Europe | 18.2 /100 | #206 | Poor 8.9% |
| Malaysians | 16.3 /100 | #207 | Poor 8.9% |
| Immigrants | Philippines | 15.8 /100 | #208 | Poor 8.9% |
| Salvadorans | 15.4 /100 | #209 | Poor 8.9% |
| Bermudans | 15.0 /100 | #210 | Poor 8.9% |
| Delaware | 14.6 /100 | #211 | Poor 9.0% |
| Romanians | 13.8 /100 | #212 | Poor 9.0% |
| Immigrants | Latin America | 13.4 /100 | #213 | Poor 9.0% |
| Immigrants | Brazil | 13.3 /100 | #214 | Poor 9.0% |
| Immigrants | Western Asia | 12.5 /100 | #215 | Poor 9.0% |
| Immigrants | Oceania | 11.8 /100 | #216 | Poor 9.0% |
| Lebanese | 11.1 /100 | #217 | Poor 9.0% |
| Immigrants | Africa | 9.7 /100 | #218 | Tragic 9.0% |
| Afghans | 8.3 /100 | #219 | Tragic 9.0% |
Demographics Similar to Finns by Unemployment Among Seniors over 75 years
In terms of unemployment among seniors over 75 years, the demographic groups most similar to Finns are Puget Sound Salish (10.0%, a difference of 0.070%), Scotch-Irish (10.0%, a difference of 0.080%), Welsh (10.0%, a difference of 0.11%), Swedish (10.0%, a difference of 0.27%), and Italian (10.0%, a difference of 0.42%).
| Demographics | Rating | Rank | Unemployment Among Seniors over 75 years |
| Immigrants | Nonimmigrants | 0.0 /100 | #295 | Tragic 9.8% |
| Immigrants | St. Vincent and the Grenadines | 0.0 /100 | #296 | Tragic 9.8% |
| Cherokee | 0.0 /100 | #297 | Tragic 9.8% |
| Lithuanians | 0.0 /100 | #298 | Tragic 9.9% |
| Belgians | 0.0 /100 | #299 | Tragic 9.9% |
| Iraqis | 0.0 /100 | #300 | Tragic 9.9% |
| Welsh | 0.0 /100 | #301 | Tragic 10.0% |
| Finns | 0.0 /100 | #302 | Tragic 10.0% |
| Puget Sound Salish | 0.0 /100 | #303 | Tragic 10.0% |
| Scotch-Irish | 0.0 /100 | #304 | Tragic 10.0% |
| Swedes | 0.0 /100 | #305 | Tragic 10.0% |
| Italians | 0.0 /100 | #306 | Tragic 10.0% |
| Immigrants | Fiji | 0.0 /100 | #307 | Tragic 10.0% |
| Whites/Caucasians | 0.0 /100 | #308 | Tragic 10.1% |
| English | 0.0 /100 | #309 | Tragic 10.1% |