Puget Sound Salish vs Lumbee Unemployment Among Ages 16 to 19 years
COMPARE
Puget Sound Salish
Lumbee
Unemployment Among Ages 16 to 19 years
Unemployment Among Ages 16 to 19 years Comparison
Puget Sound Salish
Lumbee
18.7%
UNEMPLOYMENT AMONG AGES 16 TO 19 YEARS
0.5/ 100
METRIC RATING
249th/ 347
METRIC RANK
19.1%
UNEMPLOYMENT AMONG AGES 16 TO 19 YEARS
0.1/ 100
METRIC RATING
269th/ 347
METRIC RANK
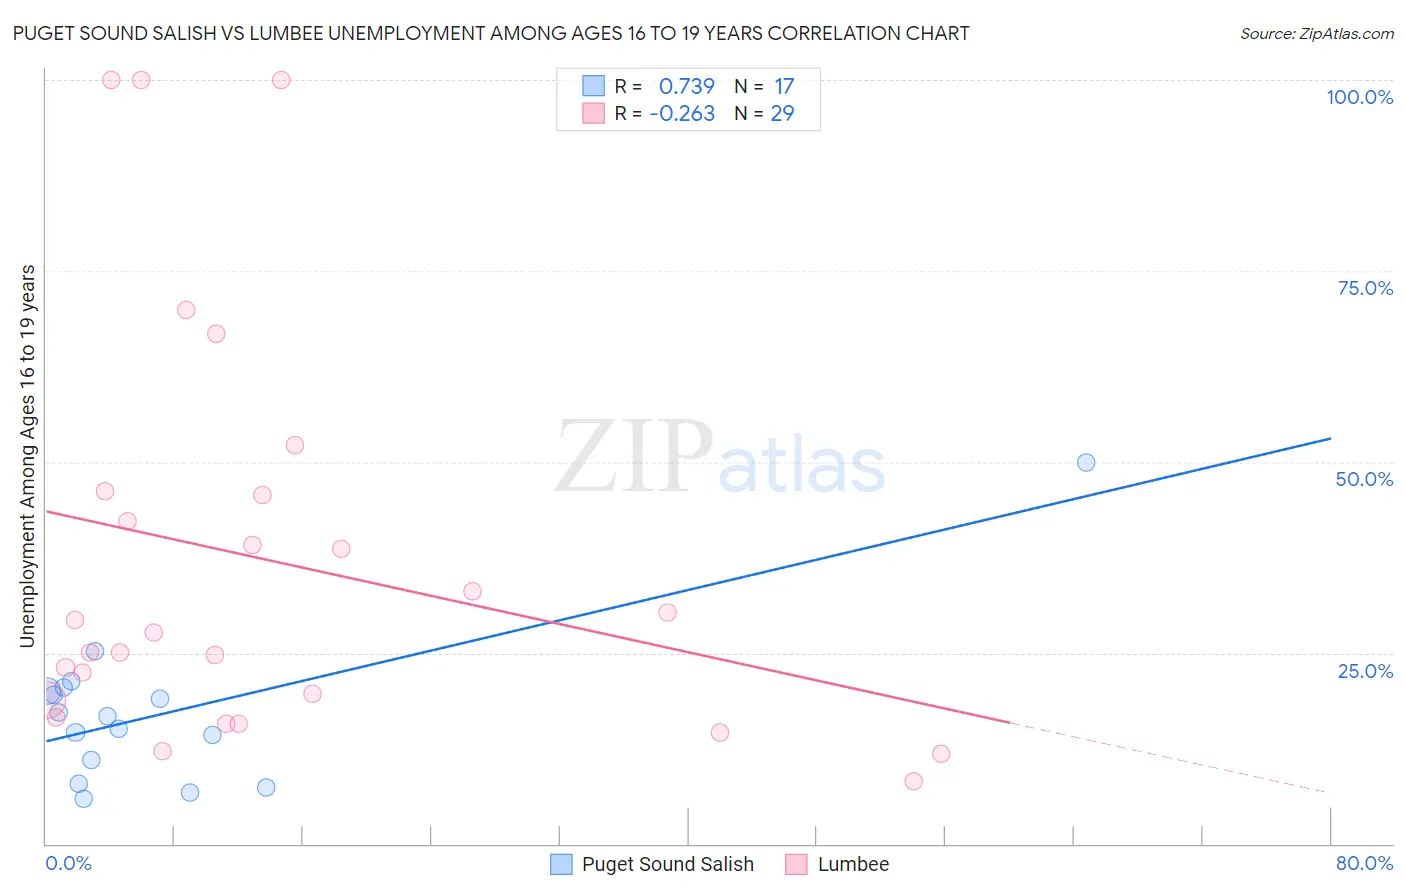
Puget Sound Salish vs Lumbee Unemployment Among Ages 16 to 19 years Correlation Chart
The statistical analysis conducted on geographies consisting of 45,291,047 people shows a strong positive correlation between the proportion of Puget Sound Salish and unemployment rate among population between the ages 16 and 19 in the United States with a correlation coefficient (R) of 0.739 and weighted average of 18.7%. Similarly, the statistical analysis conducted on geographies consisting of 90,019,475 people shows a weak negative correlation between the proportion of Lumbee and unemployment rate among population between the ages 16 and 19 in the United States with a correlation coefficient (R) of -0.263 and weighted average of 19.1%, a difference of 2.3%.
Unemployment Among Ages 16 to 19 years Correlation Summary
| Measurement | Puget Sound Salish | Lumbee |
| Minimum | 5.8% | 8.2% |
| Maximum | 50.0% | 100.0% |
| Range | 44.2% | 91.8% |
| Mean | 17.2% | 37.0% |
| Median | 16.7% | 27.6% |
| Interquartile 25% (IQ1) | 9.4% | 17.7% |
| Interquartile 75% (IQ3) | 20.2% | 46.0% |
| Interquartile Range (IQR) | 10.8% | 28.3% |
| Standard Deviation (Sample) | 10.2% | 26.7% |
| Standard Deviation (Population) | 9.9% | 26.2% |
Demographics Similar to Puget Sound Salish and Lumbee by Unemployment Among Ages 16 to 19 years
In terms of unemployment among ages 16 to 19 years, the demographic groups most similar to Puget Sound Salish are Panamanian (18.7%, a difference of 0.11%), Subsaharan African (18.7%, a difference of 0.22%), Immigrants from Guatemala (18.7%, a difference of 0.24%), Central American (18.8%, a difference of 0.55%), and Apache (18.8%, a difference of 0.58%). Similarly, the demographic groups most similar to Lumbee are Immigrants from El Salvador (19.1%, a difference of 0.080%), Israeli (19.0%, a difference of 0.36%), Immigrants from Honduras (19.0%, a difference of 0.71%), Choctaw (19.0%, a difference of 0.80%), and Yaqui (19.0%, a difference of 0.81%).
| Demographics | Rating | Rank | Unemployment Among Ages 16 to 19 years |
| Puget Sound Salish | 0.5 /100 | #249 | Tragic 18.7% |
| Panamanians | 0.4 /100 | #250 | Tragic 18.7% |
| Sub-Saharan Africans | 0.4 /100 | #251 | Tragic 18.7% |
| Immigrants | Guatemala | 0.4 /100 | #252 | Tragic 18.7% |
| Central Americans | 0.3 /100 | #253 | Tragic 18.8% |
| Apache | 0.3 /100 | #254 | Tragic 18.8% |
| Immigrants | Cameroon | 0.3 /100 | #255 | Tragic 18.8% |
| Mexican American Indians | 0.3 /100 | #256 | Tragic 18.8% |
| Immigrants | Nigeria | 0.2 /100 | #257 | Tragic 18.9% |
| Immigrants | Mexico | 0.2 /100 | #258 | Tragic 18.9% |
| Immigrants | Central America | 0.2 /100 | #259 | Tragic 18.9% |
| Nigerians | 0.2 /100 | #260 | Tragic 18.9% |
| Spanish American Indians | 0.1 /100 | #261 | Tragic 18.9% |
| Salvadorans | 0.1 /100 | #262 | Tragic 18.9% |
| Cree | 0.1 /100 | #263 | Tragic 19.0% |
| Yaqui | 0.1 /100 | #264 | Tragic 19.0% |
| Choctaw | 0.1 /100 | #265 | Tragic 19.0% |
| Immigrants | Honduras | 0.1 /100 | #266 | Tragic 19.0% |
| Israelis | 0.1 /100 | #267 | Tragic 19.0% |
| Immigrants | El Salvador | 0.1 /100 | #268 | Tragic 19.1% |
| Lumbee | 0.1 /100 | #269 | Tragic 19.1% |