Puget Sound Salish vs Immigrants from Cameroon Unemployment Among Youth under 25 years
COMPARE
Puget Sound Salish
Immigrants from Cameroon
Unemployment Among Youth under 25 years
Unemployment Among Youth under 25 years Comparison
Puget Sound Salish
Immigrants from Cameroon
12.5%
UNEMPLOYMENT AMONG YOUTH UNDER 25 YEARS
0.1/ 100
METRIC RATING
264th/ 347
METRIC RANK
13.3%
UNEMPLOYMENT AMONG YOUTH UNDER 25 YEARS
0.0/ 100
METRIC RATING
283rd/ 347
METRIC RANK
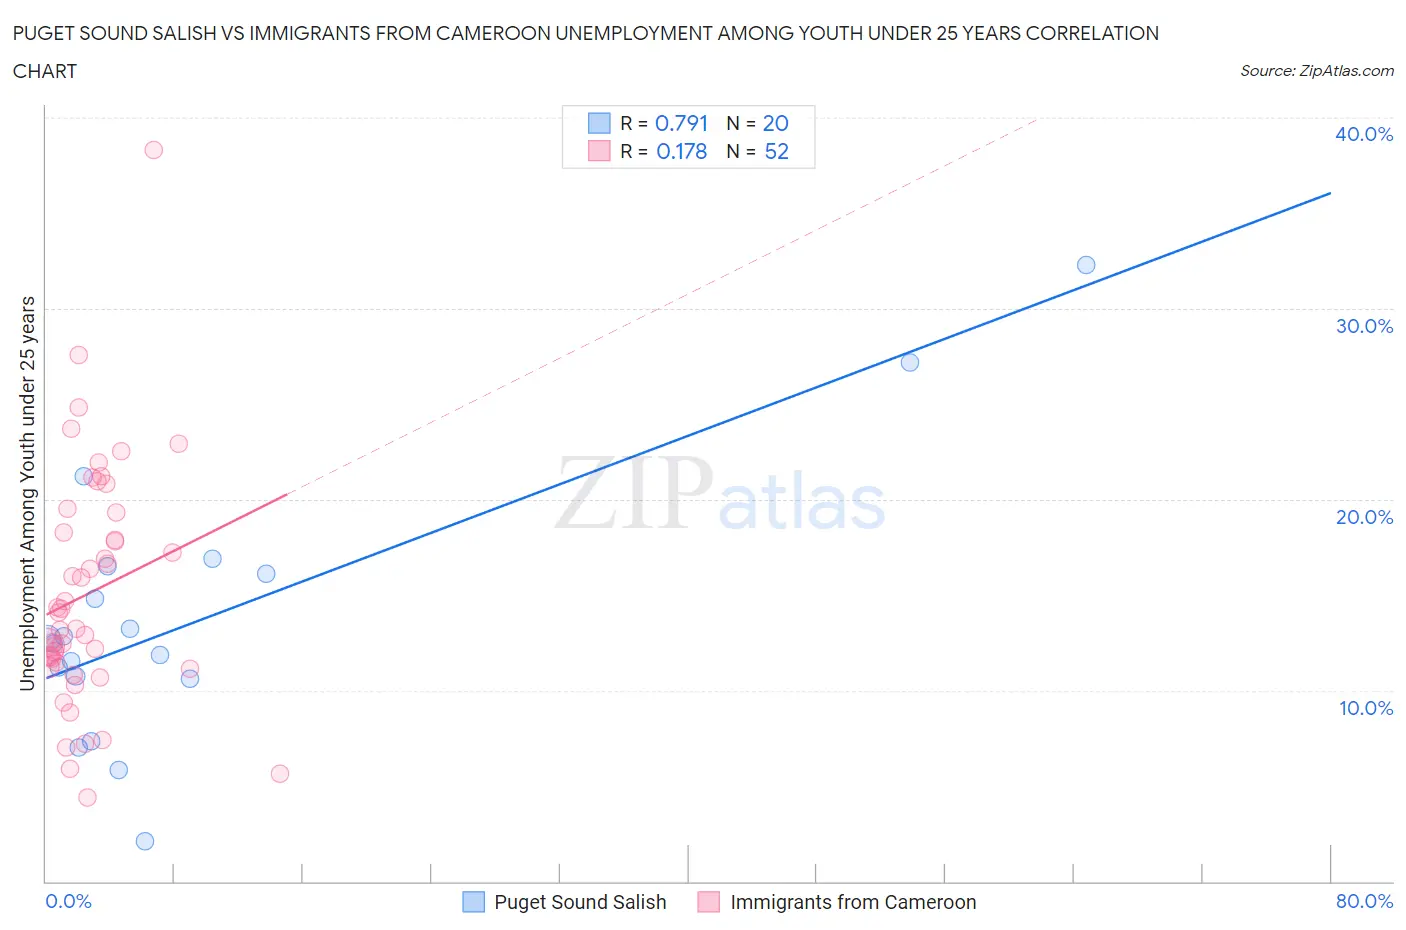
Puget Sound Salish vs Immigrants from Cameroon Unemployment Among Youth under 25 years Correlation Chart
The statistical analysis conducted on geographies consisting of 45,930,945 people shows a strong positive correlation between the proportion of Puget Sound Salish and unemployment rate among youth under the age of 25 in the United States with a correlation coefficient (R) of 0.791 and weighted average of 12.5%. Similarly, the statistical analysis conducted on geographies consisting of 130,379,690 people shows a poor positive correlation between the proportion of Immigrants from Cameroon and unemployment rate among youth under the age of 25 in the United States with a correlation coefficient (R) of 0.178 and weighted average of 13.3%, a difference of 6.3%.
Unemployment Among Youth under 25 years Correlation Summary
| Measurement | Puget Sound Salish | Immigrants from Cameroon |
| Minimum | 2.1% | 4.4% |
| Maximum | 32.3% | 38.3% |
| Range | 30.2% | 33.9% |
| Mean | 13.7% | 15.1% |
| Median | 12.6% | 13.6% |
| Interquartile 25% (IQ1) | 10.7% | 11.3% |
| Interquartile 75% (IQ3) | 16.3% | 18.8% |
| Interquartile Range (IQR) | 5.6% | 7.5% |
| Standard Deviation (Sample) | 7.0% | 6.2% |
| Standard Deviation (Population) | 6.8% | 6.2% |
Demographics Similar to Puget Sound Salish and Immigrants from Cameroon by Unemployment Among Youth under 25 years
In terms of unemployment among youth under 25 years, the demographic groups most similar to Puget Sound Salish are Nepalese (12.5%, a difference of 0.10%), Cree (12.4%, a difference of 0.47%), Immigrants from Latin America (12.6%, a difference of 1.0%), Subsaharan African (12.6%, a difference of 1.1%), and Tlingit-Haida (12.7%, a difference of 1.2%). Similarly, the demographic groups most similar to Immigrants from Cameroon are Sierra Leonean (13.3%, a difference of 0.020%), Armenian (13.3%, a difference of 0.030%), Ute (13.3%, a difference of 0.060%), Cajun (13.2%, a difference of 0.32%), and African (13.2%, a difference of 0.98%).
| Demographics | Rating | Rank | Unemployment Among Youth under 25 years |
| Cree | 0.1 /100 | #263 | Tragic 12.4% |
| Puget Sound Salish | 0.1 /100 | #264 | Tragic 12.5% |
| Nepalese | 0.0 /100 | #265 | Tragic 12.5% |
| Immigrants | Latin America | 0.0 /100 | #266 | Tragic 12.6% |
| Sub-Saharan Africans | 0.0 /100 | #267 | Tragic 12.6% |
| Tlingit-Haida | 0.0 /100 | #268 | Tragic 12.7% |
| Kiowa | 0.0 /100 | #269 | Tragic 12.7% |
| Immigrants | Liberia | 0.0 /100 | #270 | Tragic 12.8% |
| Immigrants | Bahamas | 0.0 /100 | #271 | Tragic 12.9% |
| Cape Verdeans | 0.0 /100 | #272 | Tragic 12.9% |
| Nigerians | 0.0 /100 | #273 | Tragic 13.0% |
| Immigrants | Nigeria | 0.0 /100 | #274 | Tragic 13.0% |
| Bermudans | 0.0 /100 | #275 | Tragic 13.0% |
| Immigrants | Uzbekistan | 0.0 /100 | #276 | Tragic 13.1% |
| Bahamians | 0.0 /100 | #277 | Tragic 13.1% |
| Africans | 0.0 /100 | #278 | Tragic 13.2% |
| Cajuns | 0.0 /100 | #279 | Tragic 13.2% |
| Ute | 0.0 /100 | #280 | Tragic 13.3% |
| Armenians | 0.0 /100 | #281 | Tragic 13.3% |
| Sierra Leoneans | 0.0 /100 | #282 | Tragic 13.3% |
| Immigrants | Cameroon | 0.0 /100 | #283 | Tragic 13.3% |