Puerto Rican vs Okinawan Unemployment Among Ages 60 to 64 years
COMPARE
Puerto Rican
Okinawan
Unemployment Among Ages 60 to 64 years
Unemployment Among Ages 60 to 64 years Comparison
Puerto Ricans
Okinawans
6.1%
UNEMPLOYMENT AMONG AGES 60 TO 64 YEARS
0.0/ 100
METRIC RATING
334th/ 347
METRIC RANK
4.7%
UNEMPLOYMENT AMONG AGES 60 TO 64 YEARS
99.1/ 100
METRIC RATING
82nd/ 347
METRIC RANK
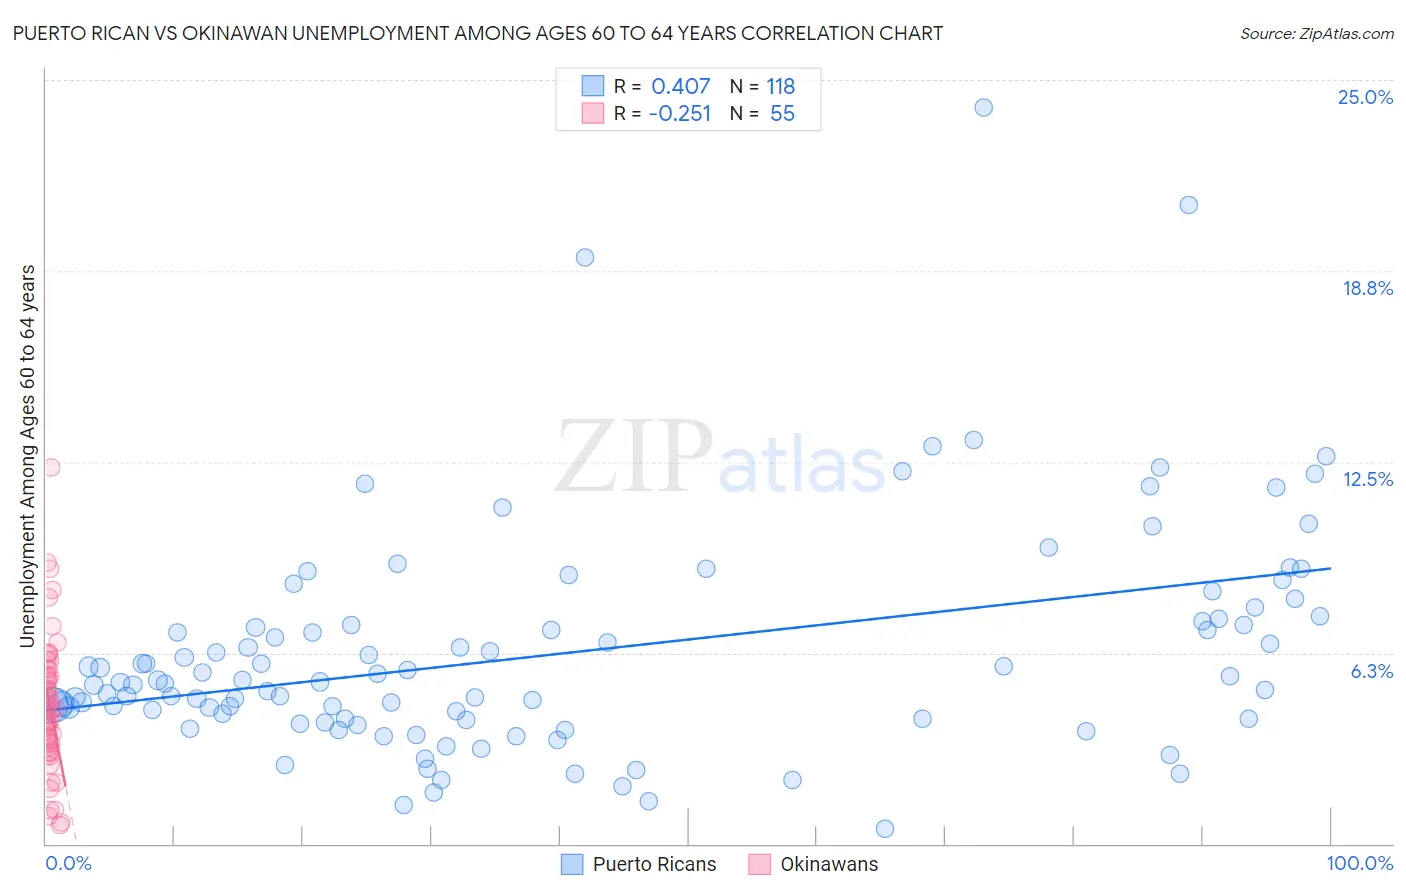
Puerto Rican vs Okinawan Unemployment Among Ages 60 to 64 years Correlation Chart
The statistical analysis conducted on geographies consisting of 450,198,803 people shows a moderate positive correlation between the proportion of Puerto Ricans and unemployment rate among population between the ages 60 and 64 in the United States with a correlation coefficient (R) of 0.407 and weighted average of 6.1%. Similarly, the statistical analysis conducted on geographies consisting of 72,270,205 people shows a weak negative correlation between the proportion of Okinawans and unemployment rate among population between the ages 60 and 64 in the United States with a correlation coefficient (R) of -0.251 and weighted average of 4.7%, a difference of 30.4%.
Unemployment Among Ages 60 to 64 years Correlation Summary
| Measurement | Puerto Rican | Okinawan |
| Minimum | 0.50% | 0.60% |
| Maximum | 24.1% | 12.3% |
| Range | 23.6% | 11.7% |
| Mean | 6.3% | 4.5% |
| Median | 5.3% | 4.4% |
| Interquartile 25% (IQ1) | 4.1% | 3.2% |
| Interquartile 75% (IQ3) | 7.3% | 5.7% |
| Interquartile Range (IQR) | 3.2% | 2.6% |
| Standard Deviation (Sample) | 3.7% | 2.2% |
| Standard Deviation (Population) | 3.7% | 2.2% |
Similar Demographics by Unemployment Among Ages 60 to 64 years
Demographics Similar to Puerto Ricans by Unemployment Among Ages 60 to 64 years
In terms of unemployment among ages 60 to 64 years, the demographic groups most similar to Puerto Ricans are Vietnamese (6.1%, a difference of 0.19%), Immigrants from Dominican Republic (6.0%, a difference of 1.2%), Dominican (6.0%, a difference of 1.6%), Yakama (6.0%, a difference of 1.6%), and Immigrants from Armenia (6.0%, a difference of 1.7%).
| Demographics | Rating | Rank | Unemployment Among Ages 60 to 64 years |
| Immigrants | Grenada | 0.0 /100 | #327 | Tragic 5.9% |
| Apache | 0.0 /100 | #328 | Tragic 6.0% |
| Immigrants | Bangladesh | 0.0 /100 | #329 | Tragic 6.0% |
| Immigrants | Armenia | 0.0 /100 | #330 | Tragic 6.0% |
| Yakama | 0.0 /100 | #331 | Tragic 6.0% |
| Dominicans | 0.0 /100 | #332 | Tragic 6.0% |
| Immigrants | Dominican Republic | 0.0 /100 | #333 | Tragic 6.0% |
| Puerto Ricans | 0.0 /100 | #334 | Tragic 6.1% |
| Vietnamese | 0.0 /100 | #335 | Tragic 6.1% |
| Kiowa | 0.0 /100 | #336 | Tragic 6.2% |
| Navajo | 0.0 /100 | #337 | Tragic 6.3% |
| Arapaho | 0.0 /100 | #338 | Tragic 6.3% |
| Tlingit-Haida | 0.0 /100 | #339 | Tragic 6.4% |
| Pueblo | 0.0 /100 | #340 | Tragic 6.7% |
| Yuman | 0.0 /100 | #341 | Tragic 6.8% |
Demographics Similar to Okinawans by Unemployment Among Ages 60 to 64 years
In terms of unemployment among ages 60 to 64 years, the demographic groups most similar to Okinawans are Iroquois (4.7%, a difference of 0.0%), Icelander (4.7%, a difference of 0.010%), Immigrants from Egypt (4.7%, a difference of 0.010%), Irish (4.7%, a difference of 0.040%), and Seminole (4.7%, a difference of 0.070%).
| Demographics | Rating | Rank | Unemployment Among Ages 60 to 64 years |
| Potawatomi | 99.3 /100 | #75 | Exceptional 4.6% |
| Slovaks | 99.3 /100 | #76 | Exceptional 4.6% |
| Immigrants | Somalia | 99.2 /100 | #77 | Exceptional 4.6% |
| Seminole | 99.2 /100 | #78 | Exceptional 4.7% |
| Irish | 99.2 /100 | #79 | Exceptional 4.7% |
| Icelanders | 99.1 /100 | #80 | Exceptional 4.7% |
| Iroquois | 99.1 /100 | #81 | Exceptional 4.7% |
| Okinawans | 99.1 /100 | #82 | Exceptional 4.7% |
| Immigrants | Egypt | 99.1 /100 | #83 | Exceptional 4.7% |
| Thais | 98.9 /100 | #84 | Exceptional 4.7% |
| Immigrants | Sri Lanka | 98.9 /100 | #85 | Exceptional 4.7% |
| Immigrants | Oceania | 98.9 /100 | #86 | Exceptional 4.7% |
| Immigrants | Jordan | 98.8 /100 | #87 | Exceptional 4.7% |
| Immigrants | Bulgaria | 98.7 /100 | #88 | Exceptional 4.7% |
| Immigrants | Northern Africa | 98.7 /100 | #89 | Exceptional 4.7% |