Potawatomi vs French Unemployment Among Ages 25 to 29 years
COMPARE
Potawatomi
French
Unemployment Among Ages 25 to 29 years
Unemployment Among Ages 25 to 29 years Comparison
Potawatomi
French
7.1%
UNEMPLOYMENT AMONG AGES 25 TO 29 YEARS
1.3/ 100
METRIC RATING
239th/ 347
METRIC RANK
6.9%
UNEMPLOYMENT AMONG AGES 25 TO 29 YEARS
10.5/ 100
METRIC RATING
220th/ 347
METRIC RANK
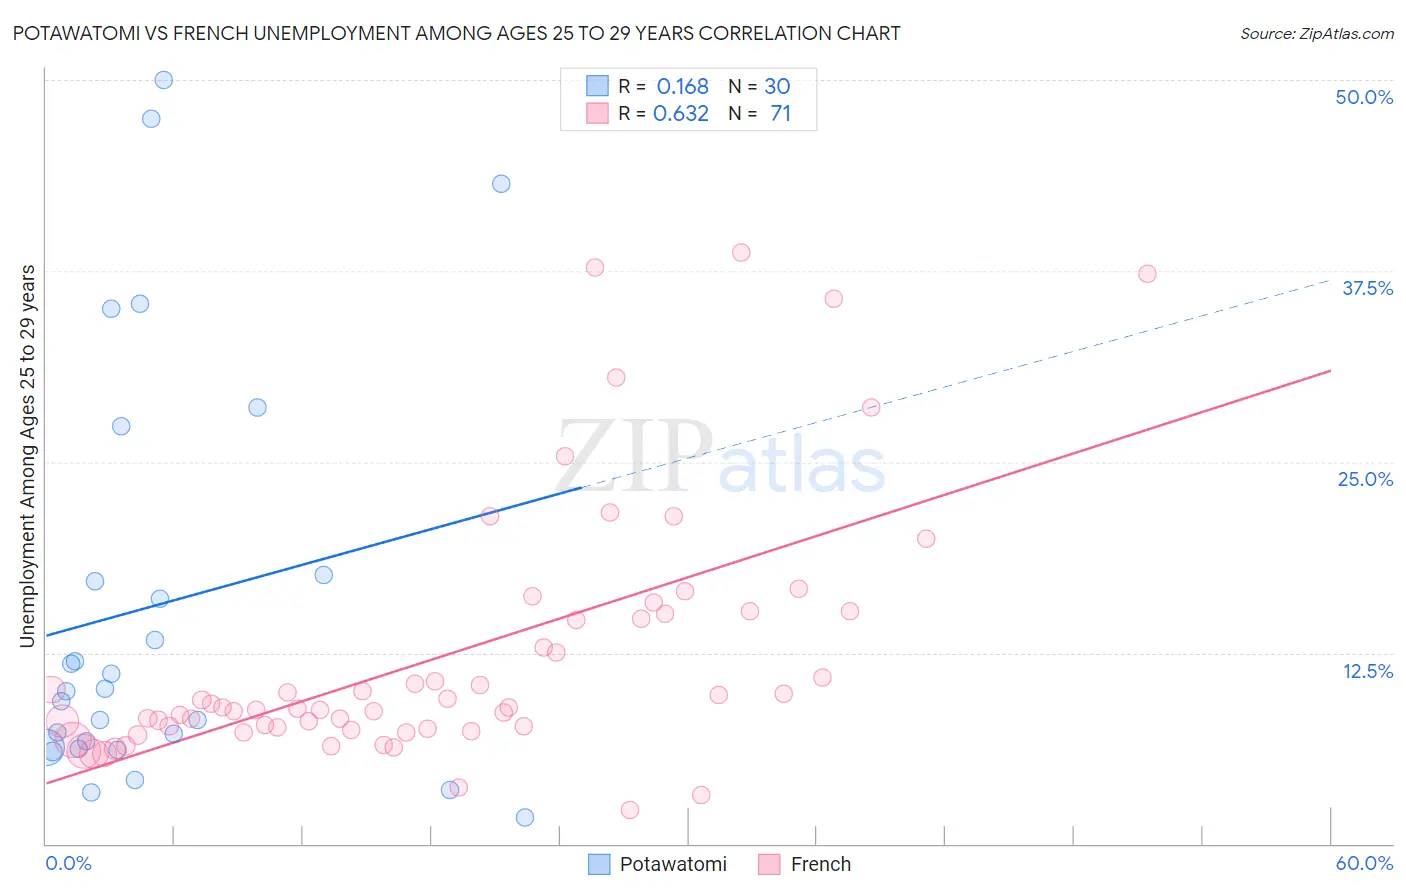
Potawatomi vs French Unemployment Among Ages 25 to 29 years Correlation Chart
The statistical analysis conducted on geographies consisting of 114,824,106 people shows a poor positive correlation between the proportion of Potawatomi and unemployment rate among population between the ages 25 and 29 in the United States with a correlation coefficient (R) of 0.168 and weighted average of 7.1%. Similarly, the statistical analysis conducted on geographies consisting of 507,503,489 people shows a significant positive correlation between the proportion of French and unemployment rate among population between the ages 25 and 29 in the United States with a correlation coefficient (R) of 0.632 and weighted average of 6.9%, a difference of 3.2%.
Unemployment Among Ages 25 to 29 years Correlation Summary
| Measurement | Potawatomi | French |
| Minimum | 1.7% | 2.2% |
| Maximum | 50.0% | 38.7% |
| Range | 48.3% | 36.5% |
| Mean | 15.7% | 12.3% |
| Median | 10.1% | 8.9% |
| Interquartile 25% (IQ1) | 6.3% | 7.5% |
| Interquartile 75% (IQ3) | 17.6% | 15.1% |
| Interquartile Range (IQR) | 11.3% | 7.5% |
| Standard Deviation (Sample) | 13.8% | 8.3% |
| Standard Deviation (Population) | 13.5% | 8.2% |
Demographics Similar to Potawatomi and French by Unemployment Among Ages 25 to 29 years
In terms of unemployment among ages 25 to 29 years, the demographic groups most similar to Potawatomi are Honduran (7.1%, a difference of 0.46%), Puget Sound Salish (7.1%, a difference of 0.48%), Cape Verdean (7.0%, a difference of 0.55%), Panamanian (7.0%, a difference of 0.69%), and French Canadian (7.0%, a difference of 0.85%). Similarly, the demographic groups most similar to French are White/Caucasian (6.9%, a difference of 0.010%), Israeli (6.9%, a difference of 0.12%), Spaniard (6.9%, a difference of 0.51%), Celtic (6.9%, a difference of 0.52%), and Immigrants (6.9%, a difference of 0.86%).
| Demographics | Rating | Rank | Unemployment Among Ages 25 to 29 years |
| Whites/Caucasians | 10.6 /100 | #219 | Poor 6.9% |
| French | 10.5 /100 | #220 | Poor 6.9% |
| Israelis | 9.8 /100 | #221 | Tragic 6.9% |
| Spaniards | 7.7 /100 | #222 | Tragic 6.9% |
| Celtics | 7.6 /100 | #223 | Tragic 6.9% |
| Immigrants | Immigrants | 6.2 /100 | #224 | Tragic 6.9% |
| Japanese | 5.4 /100 | #225 | Tragic 6.9% |
| Immigrants | Liberia | 4.8 /100 | #226 | Tragic 7.0% |
| Salvadorans | 4.4 /100 | #227 | Tragic 7.0% |
| Immigrants | Panama | 4.2 /100 | #228 | Tragic 7.0% |
| Bermudans | 3.8 /100 | #229 | Tragic 7.0% |
| Immigrants | El Salvador | 3.6 /100 | #230 | Tragic 7.0% |
| Central Americans | 3.0 /100 | #231 | Tragic 7.0% |
| Spanish Americans | 2.7 /100 | #232 | Tragic 7.0% |
| Immigrants | Honduras | 2.4 /100 | #233 | Tragic 7.0% |
| French Canadians | 2.4 /100 | #234 | Tragic 7.0% |
| Panamanians | 2.1 /100 | #235 | Tragic 7.0% |
| Cape Verdeans | 1.9 /100 | #236 | Tragic 7.0% |
| Puget Sound Salish | 1.8 /100 | #237 | Tragic 7.1% |
| Hondurans | 1.8 /100 | #238 | Tragic 7.1% |
| Potawatomi | 1.3 /100 | #239 | Tragic 7.1% |