Portuguese vs Menominee Unemployment Among Ages 25 to 29 years
COMPARE
Portuguese
Menominee
Unemployment Among Ages 25 to 29 years
Unemployment Among Ages 25 to 29 years Comparison
Portuguese
Menominee
7.2%
UNEMPLOYMENT AMONG AGES 25 TO 29 YEARS
0.5/ 100
METRIC RATING
251st/ 347
METRIC RANK
11.3%
UNEMPLOYMENT AMONG AGES 25 TO 29 YEARS
0.0/ 100
METRIC RATING
337th/ 347
METRIC RANK
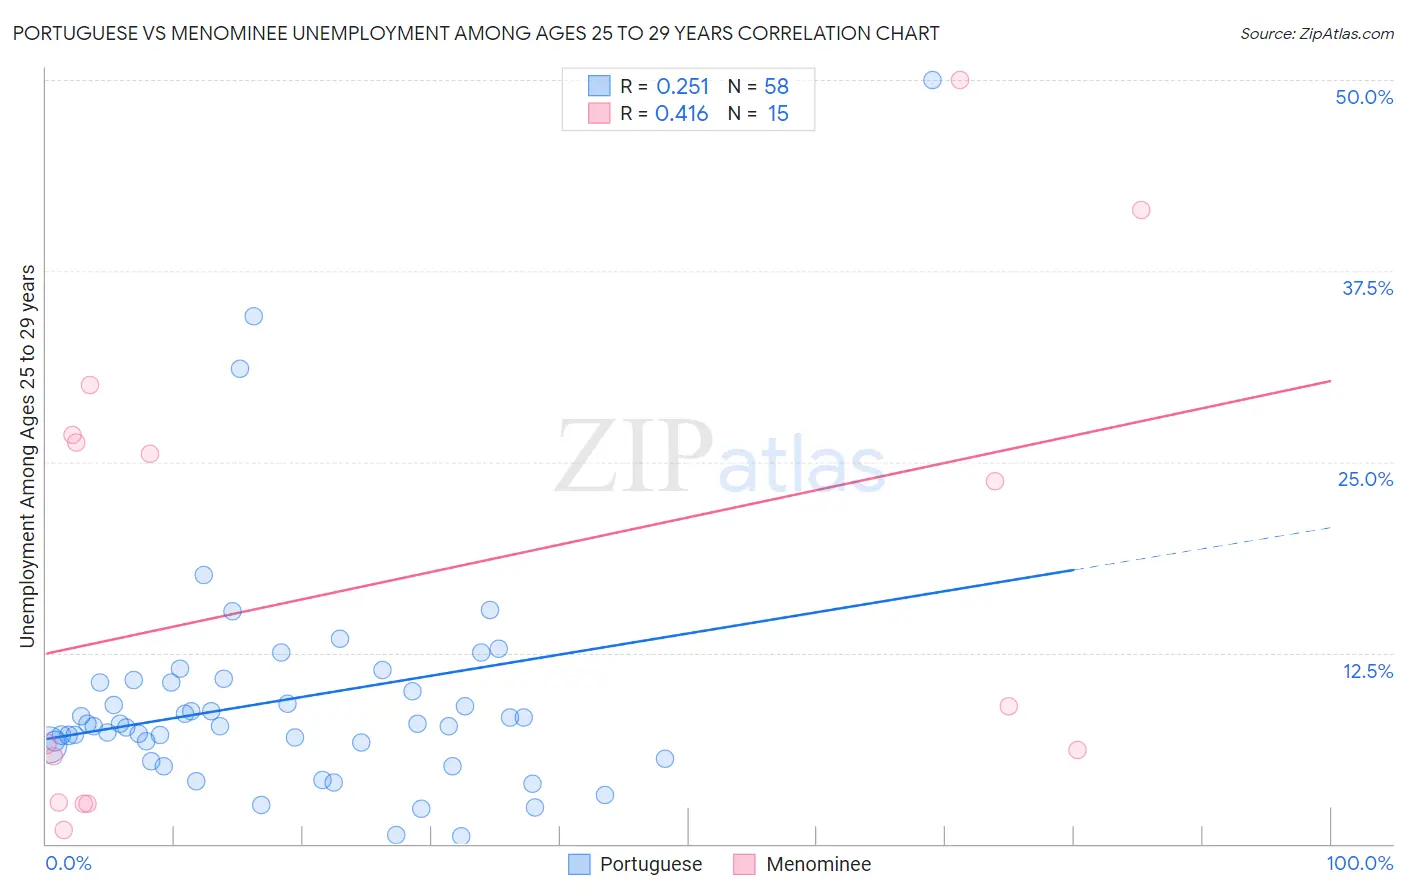
Portuguese vs Menominee Unemployment Among Ages 25 to 29 years Correlation Chart
The statistical analysis conducted on geographies consisting of 421,376,294 people shows a weak positive correlation between the proportion of Portuguese and unemployment rate among population between the ages 25 and 29 in the United States with a correlation coefficient (R) of 0.251 and weighted average of 7.2%. Similarly, the statistical analysis conducted on geographies consisting of 44,934,192 people shows a moderate positive correlation between the proportion of Menominee and unemployment rate among population between the ages 25 and 29 in the United States with a correlation coefficient (R) of 0.416 and weighted average of 11.3%, a difference of 56.8%.
Unemployment Among Ages 25 to 29 years Correlation Summary
| Measurement | Portuguese | Menominee |
| Minimum | 0.50% | 0.91% |
| Maximum | 50.0% | 50.0% |
| Range | 49.5% | 49.1% |
| Mean | 9.5% | 17.3% |
| Median | 7.8% | 9.0% |
| Interquartile 25% (IQ1) | 6.5% | 2.7% |
| Interquartile 75% (IQ3) | 10.6% | 26.8% |
| Interquartile Range (IQR) | 4.1% | 24.1% |
| Standard Deviation (Sample) | 7.9% | 15.7% |
| Standard Deviation (Population) | 7.8% | 15.2% |
Similar Demographics by Unemployment Among Ages 25 to 29 years
Demographics Similar to Portuguese by Unemployment Among Ages 25 to 29 years
In terms of unemployment among ages 25 to 29 years, the demographic groups most similar to Portuguese are Delaware (7.2%, a difference of 0.060%), Seminole (7.2%, a difference of 0.22%), Subsaharan African (7.2%, a difference of 0.25%), Sierra Leonean (7.2%, a difference of 0.26%), and Immigrants from Guatemala (7.2%, a difference of 0.41%).
| Demographics | Rating | Rank | Unemployment Among Ages 25 to 29 years |
| Immigrants | Nonimmigrants | 0.9 /100 | #244 | Tragic 7.1% |
| Guatemalans | 0.9 /100 | #245 | Tragic 7.1% |
| Immigrants | Uzbekistan | 0.7 /100 | #246 | Tragic 7.2% |
| Immigrants | Guatemala | 0.7 /100 | #247 | Tragic 7.2% |
| Sub-Saharan Africans | 0.6 /100 | #248 | Tragic 7.2% |
| Seminole | 0.6 /100 | #249 | Tragic 7.2% |
| Delaware | 0.5 /100 | #250 | Tragic 7.2% |
| Portuguese | 0.5 /100 | #251 | Tragic 7.2% |
| Sierra Leoneans | 0.4 /100 | #252 | Tragic 7.2% |
| Immigrants | Portugal | 0.3 /100 | #253 | Tragic 7.2% |
| Ghanaians | 0.3 /100 | #254 | Tragic 7.2% |
| Immigrants | Cameroon | 0.3 /100 | #255 | Tragic 7.2% |
| Mexican American Indians | 0.3 /100 | #256 | Tragic 7.3% |
| Assyrians/Chaldeans/Syriacs | 0.2 /100 | #257 | Tragic 7.3% |
| Ottawa | 0.1 /100 | #258 | Tragic 7.3% |
Demographics Similar to Menominee by Unemployment Among Ages 25 to 29 years
In terms of unemployment among ages 25 to 29 years, the demographic groups most similar to Menominee are Lumbee (11.2%, a difference of 0.28%), Puerto Rican (11.1%, a difference of 1.3%), Yuman (11.0%, a difference of 2.5%), Sioux (11.7%, a difference of 3.5%), and Pima (11.8%, a difference of 4.5%).
| Demographics | Rating | Rank | Unemployment Among Ages 25 to 29 years |
| Natives/Alaskans | 0.0 /100 | #330 | Tragic 9.8% |
| Alaska Natives | 0.0 /100 | #331 | Tragic 10.2% |
| Pueblo | 0.0 /100 | #332 | Tragic 10.4% |
| Alaskan Athabascans | 0.0 /100 | #333 | Tragic 10.8% |
| Yuman | 0.0 /100 | #334 | Tragic 11.0% |
| Puerto Ricans | 0.0 /100 | #335 | Tragic 11.1% |
| Lumbee | 0.0 /100 | #336 | Tragic 11.2% |
| Menominee | 0.0 /100 | #337 | Tragic 11.3% |
| Sioux | 0.0 /100 | #338 | Tragic 11.7% |
| Pima | 0.0 /100 | #339 | Tragic 11.8% |
| Cheyenne | 0.0 /100 | #340 | Tragic 11.8% |
| Tohono O'odham | 0.0 /100 | #341 | Tragic 12.1% |
| Navajo | 0.0 /100 | #342 | Tragic 12.2% |
| Inupiat | 0.0 /100 | #343 | Tragic 13.4% |
| Hopi | 0.0 /100 | #344 | Tragic 13.5% |