Polish vs Immigrants from Uruguay Unemployment Among Women with Children Under 18 years
COMPARE
Polish
Immigrants from Uruguay
Unemployment Among Women with Children Under 18 years
Unemployment Among Women with Children Under 18 years Comparison
Poles
Immigrants from Uruguay
5.0%
UNEMPLOYMENT AMONG WOMEN WITH CHILDREN UNDER 18 YEARS
99.2/ 100
METRIC RATING
37th/ 347
METRIC RANK
5.9%
UNEMPLOYMENT AMONG WOMEN WITH CHILDREN UNDER 18 YEARS
1.1/ 100
METRIC RATING
243rd/ 347
METRIC RANK
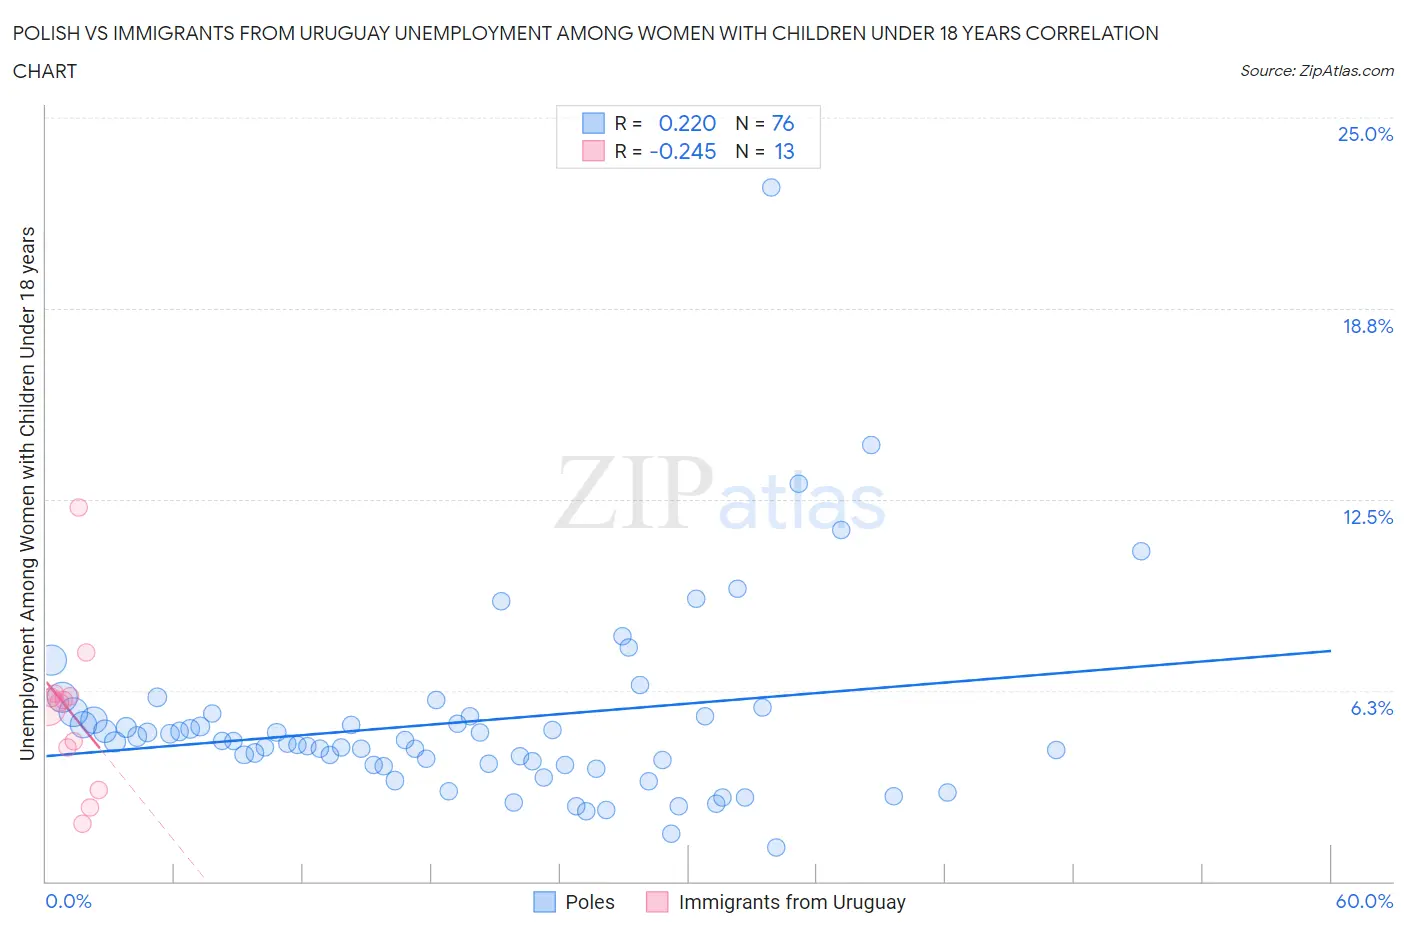
Polish vs Immigrants from Uruguay Unemployment Among Women with Children Under 18 years Correlation Chart
The statistical analysis conducted on geographies consisting of 508,328,187 people shows a weak positive correlation between the proportion of Poles and unemployment rate among women with children under the age of 18 in the United States with a correlation coefficient (R) of 0.220 and weighted average of 5.0%. Similarly, the statistical analysis conducted on geographies consisting of 131,973,027 people shows a weak negative correlation between the proportion of Immigrants from Uruguay and unemployment rate among women with children under the age of 18 in the United States with a correlation coefficient (R) of -0.245 and weighted average of 5.9%, a difference of 17.9%.
Unemployment Among Women with Children Under 18 years Correlation Summary
| Measurement | Polish | Immigrants from Uruguay |
| Minimum | 1.1% | 1.9% |
| Maximum | 22.7% | 12.2% |
| Range | 21.6% | 10.3% |
| Mean | 5.2% | 5.5% |
| Median | 4.6% | 5.9% |
| Interquartile 25% (IQ1) | 3.8% | 3.7% |
| Interquartile 75% (IQ3) | 5.4% | 6.1% |
| Interquartile Range (IQR) | 1.6% | 2.4% |
| Standard Deviation (Sample) | 3.1% | 2.6% |
| Standard Deviation (Population) | 3.1% | 2.5% |
Similar Demographics by Unemployment Among Women with Children Under 18 years
Demographics Similar to Poles by Unemployment Among Women with Children Under 18 years
In terms of unemployment among women with children under 18 years, the demographic groups most similar to Poles are Mongolian (5.0%, a difference of 0.020%), Bhutanese (5.0%, a difference of 0.030%), Luxembourger (5.0%, a difference of 0.080%), English (5.0%, a difference of 0.13%), and Immigrants from South Central Asia (5.0%, a difference of 0.14%).
| Demographics | Rating | Rank | Unemployment Among Women with Children Under 18 years |
| Burmese | 99.4 /100 | #30 | Exceptional 4.9% |
| Cypriots | 99.3 /100 | #31 | Exceptional 5.0% |
| Dutch | 99.3 /100 | #32 | Exceptional 5.0% |
| Croatians | 99.3 /100 | #33 | Exceptional 5.0% |
| Immigrants | South Central Asia | 99.2 /100 | #34 | Exceptional 5.0% |
| Luxembourgers | 99.2 /100 | #35 | Exceptional 5.0% |
| Mongolians | 99.2 /100 | #36 | Exceptional 5.0% |
| Poles | 99.2 /100 | #37 | Exceptional 5.0% |
| Bhutanese | 99.2 /100 | #38 | Exceptional 5.0% |
| English | 99.1 /100 | #39 | Exceptional 5.0% |
| Greeks | 99.0 /100 | #40 | Exceptional 5.0% |
| Immigrants | Bosnia and Herzegovina | 99.0 /100 | #41 | Exceptional 5.0% |
| Eastern Europeans | 98.9 /100 | #42 | Exceptional 5.0% |
| Turks | 98.9 /100 | #43 | Exceptional 5.0% |
| Immigrants | Moldova | 98.9 /100 | #44 | Exceptional 5.0% |
Demographics Similar to Immigrants from Uruguay by Unemployment Among Women with Children Under 18 years
In terms of unemployment among women with children under 18 years, the demographic groups most similar to Immigrants from Uruguay are Choctaw (5.9%, a difference of 0.050%), Ugandan (5.9%, a difference of 0.090%), Uruguayan (5.9%, a difference of 0.22%), Moroccan (5.9%, a difference of 0.29%), and Cape Verdean (5.9%, a difference of 0.29%).
| Demographics | Rating | Rank | Unemployment Among Women with Children Under 18 years |
| Alsatians | 2.5 /100 | #236 | Tragic 5.8% |
| Immigrants | Lebanon | 2.4 /100 | #237 | Tragic 5.8% |
| Immigrants | Somalia | 2.2 /100 | #238 | Tragic 5.8% |
| Immigrants | Sierra Leone | 2.0 /100 | #239 | Tragic 5.8% |
| Immigrants | Immigrants | 2.0 /100 | #240 | Tragic 5.8% |
| Brazilians | 1.6 /100 | #241 | Tragic 5.8% |
| Moroccans | 1.4 /100 | #242 | Tragic 5.9% |
| Immigrants | Uruguay | 1.1 /100 | #243 | Tragic 5.9% |
| Choctaw | 1.1 /100 | #244 | Tragic 5.9% |
| Ugandans | 1.1 /100 | #245 | Tragic 5.9% |
| Uruguayans | 1.0 /100 | #246 | Tragic 5.9% |
| Cape Verdeans | 1.0 /100 | #247 | Tragic 5.9% |
| Delaware | 0.8 /100 | #248 | Tragic 5.9% |
| Immigrants | Cameroon | 0.8 /100 | #249 | Tragic 5.9% |
| Immigrants | Cabo Verde | 0.7 /100 | #250 | Tragic 5.9% |