Polish vs English Unemployment Among Ages 55 to 59 years
COMPARE
Polish
English
Unemployment Among Ages 55 to 59 years
Unemployment Among Ages 55 to 59 years Comparison
Poles
English
4.7%
UNEMPLOYMENT AMONG AGES 55 TO 59 YEARS
96.9/ 100
METRIC RATING
87th/ 347
METRIC RANK
4.5%
UNEMPLOYMENT AMONG AGES 55 TO 59 YEARS
99.9/ 100
METRIC RATING
39th/ 347
METRIC RANK
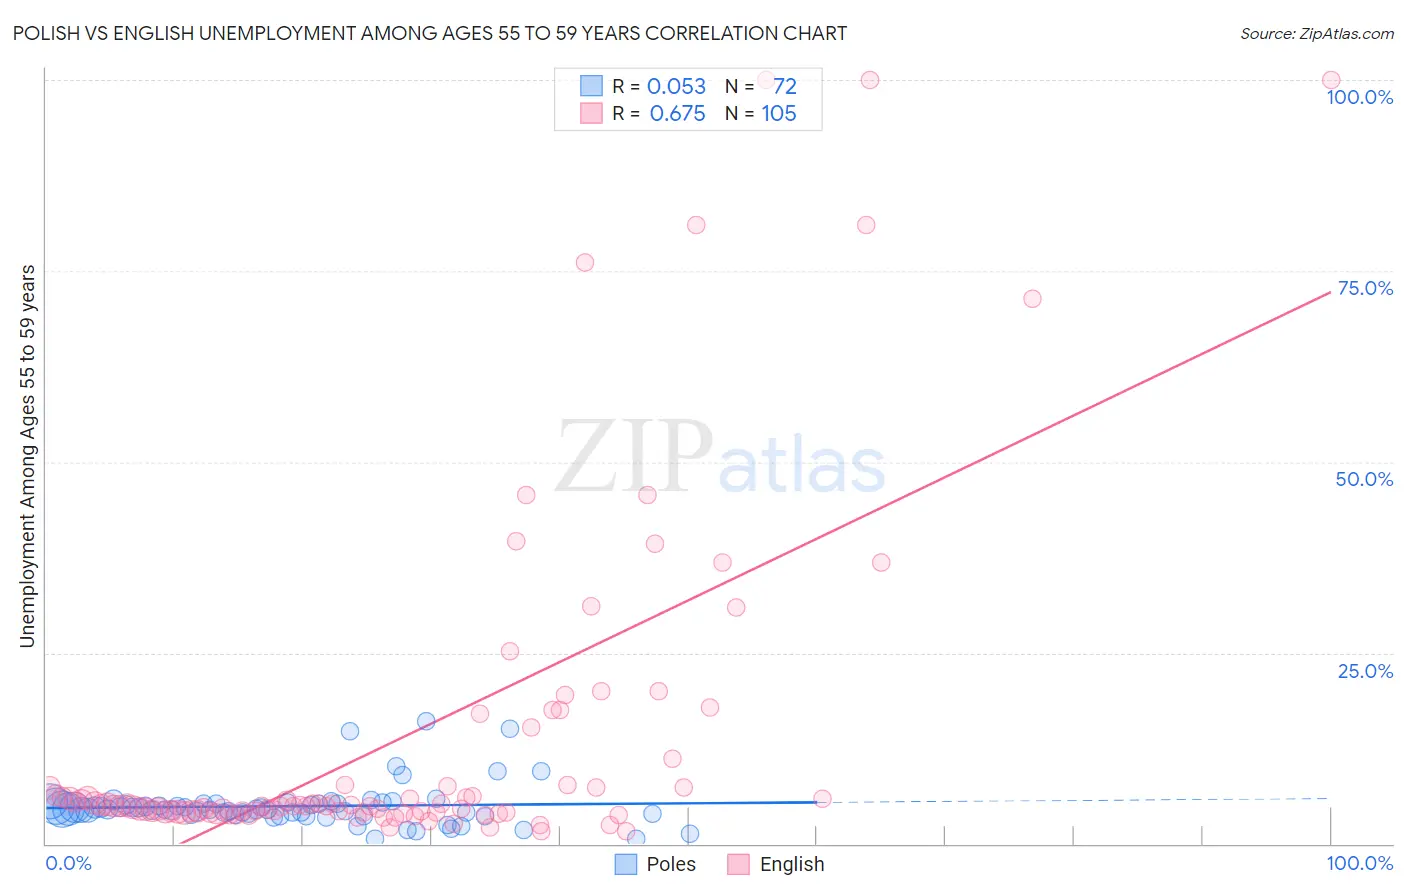
Polish vs English Unemployment Among Ages 55 to 59 years Correlation Chart
The statistical analysis conducted on geographies consisting of 480,926,987 people shows a slight positive correlation between the proportion of Poles and unemployment rate among population between the ages 55 and 59 in the United States with a correlation coefficient (R) of 0.053 and weighted average of 4.7%. Similarly, the statistical analysis conducted on geographies consisting of 488,949,268 people shows a significant positive correlation between the proportion of English and unemployment rate among population between the ages 55 and 59 in the United States with a correlation coefficient (R) of 0.675 and weighted average of 4.5%, a difference of 3.4%.
Unemployment Among Ages 55 to 59 years Correlation Summary
| Measurement | Polish | English |
| Minimum | 0.60% | 1.6% |
| Maximum | 16.1% | 100.0% |
| Range | 15.5% | 98.4% |
| Mean | 4.9% | 14.0% |
| Median | 4.5% | 5.0% |
| Interquartile 25% (IQ1) | 3.9% | 4.2% |
| Interquartile 75% (IQ3) | 5.2% | 7.7% |
| Interquartile Range (IQR) | 1.3% | 3.5% |
| Standard Deviation (Sample) | 2.8% | 22.1% |
| Standard Deviation (Population) | 2.7% | 22.0% |
Similar Demographics by Unemployment Among Ages 55 to 59 years
Demographics Similar to Poles by Unemployment Among Ages 55 to 59 years
In terms of unemployment among ages 55 to 59 years, the demographic groups most similar to Poles are Immigrants from Cameroon (4.7%, a difference of 0.0%), Immigrants from Colombia (4.7%, a difference of 0.020%), Irish (4.7%, a difference of 0.020%), Malaysian (4.7%, a difference of 0.030%), and Immigrants from Vietnam (4.7%, a difference of 0.030%).
| Demographics | Rating | Rank | Unemployment Among Ages 55 to 59 years |
| Cambodians | 98.0 /100 | #80 | Exceptional 4.6% |
| Taiwanese | 97.9 /100 | #81 | Exceptional 4.6% |
| Latvians | 97.8 /100 | #82 | Exceptional 4.6% |
| Lebanese | 97.5 /100 | #83 | Exceptional 4.6% |
| Malaysians | 96.9 /100 | #84 | Exceptional 4.7% |
| Immigrants | Vietnam | 96.9 /100 | #85 | Exceptional 4.7% |
| Immigrants | Colombia | 96.9 /100 | #86 | Exceptional 4.7% |
| Poles | 96.9 /100 | #87 | Exceptional 4.7% |
| Immigrants | Cameroon | 96.9 /100 | #88 | Exceptional 4.7% |
| Irish | 96.8 /100 | #89 | Exceptional 4.7% |
| Immigrants | Poland | 96.4 /100 | #90 | Exceptional 4.7% |
| New Zealanders | 96.3 /100 | #91 | Exceptional 4.7% |
| Iraqis | 96.1 /100 | #92 | Exceptional 4.7% |
| Immigrants | England | 95.8 /100 | #93 | Exceptional 4.7% |
| Immigrants | Scotland | 95.7 /100 | #94 | Exceptional 4.7% |
Demographics Similar to English by Unemployment Among Ages 55 to 59 years
In terms of unemployment among ages 55 to 59 years, the demographic groups most similar to English are Assyrian/Chaldean/Syriac (4.5%, a difference of 0.26%), Swiss (4.5%, a difference of 0.26%), Luxembourger (4.5%, a difference of 0.27%), Immigrants from Kuwait (4.5%, a difference of 0.29%), and Immigrants from Korea (4.5%, a difference of 0.33%).
| Demographics | Rating | Rank | Unemployment Among Ages 55 to 59 years |
| Immigrants | Ethiopia | 99.9 /100 | #32 | Exceptional 4.5% |
| Belgians | 99.9 /100 | #33 | Exceptional 4.5% |
| Thais | 99.9 /100 | #34 | Exceptional 4.5% |
| Cypriots | 99.9 /100 | #35 | Exceptional 4.5% |
| Ethiopians | 99.9 /100 | #36 | Exceptional 4.5% |
| Immigrants | Bulgaria | 99.9 /100 | #37 | Exceptional 4.5% |
| Assyrians/Chaldeans/Syriacs | 99.9 /100 | #38 | Exceptional 4.5% |
| English | 99.9 /100 | #39 | Exceptional 4.5% |
| Swiss | 99.8 /100 | #40 | Exceptional 4.5% |
| Luxembourgers | 99.8 /100 | #41 | Exceptional 4.5% |
| Immigrants | Kuwait | 99.8 /100 | #42 | Exceptional 4.5% |
| Immigrants | Korea | 99.8 /100 | #43 | Exceptional 4.5% |
| Europeans | 99.8 /100 | #44 | Exceptional 4.5% |
| British | 99.8 /100 | #45 | Exceptional 4.5% |
| Immigrants | Zaire | 99.8 /100 | #46 | Exceptional 4.5% |