Pima vs Immigrants from South America Unemployment Among Ages 30 to 34 years
COMPARE
Pima
Immigrants from South America
Unemployment Among Ages 30 to 34 years
Unemployment Among Ages 30 to 34 years Comparison
Pima
Immigrants from South America
9.6%
UNEMPLOYMENT AMONG AGES 30 TO 34 YEARS
0.0/ 100
METRIC RATING
337th/ 347
METRIC RANK
5.5%
UNEMPLOYMENT AMONG AGES 30 TO 34 YEARS
29.8/ 100
METRIC RATING
196th/ 347
METRIC RANK
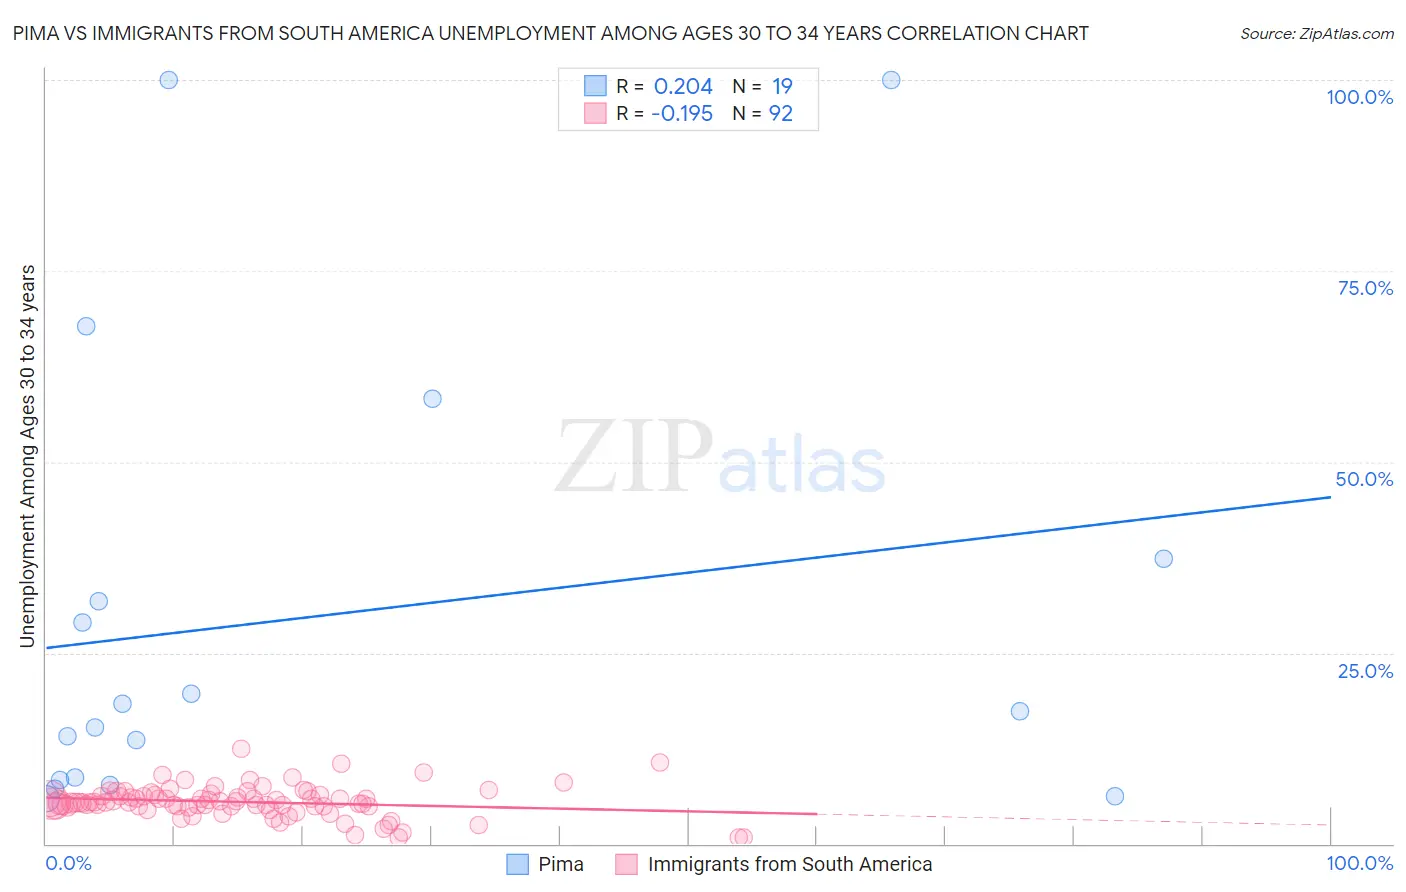
Pima vs Immigrants from South America Unemployment Among Ages 30 to 34 years Correlation Chart
The statistical analysis conducted on geographies consisting of 60,756,236 people shows a weak positive correlation between the proportion of Pima and unemployment rate among population between the ages 30 and 34 in the United States with a correlation coefficient (R) of 0.204 and weighted average of 9.6%. Similarly, the statistical analysis conducted on geographies consisting of 448,094,916 people shows a poor negative correlation between the proportion of Immigrants from South America and unemployment rate among population between the ages 30 and 34 in the United States with a correlation coefficient (R) of -0.195 and weighted average of 5.5%, a difference of 74.1%.
Unemployment Among Ages 30 to 34 years Correlation Summary
| Measurement | Pima | Immigrants from South America |
| Minimum | 5.9% | 0.80% |
| Maximum | 100.0% | 12.5% |
| Range | 94.1% | 11.7% |
| Mean | 29.8% | 5.5% |
| Median | 17.3% | 5.4% |
| Interquartile 25% (IQ1) | 8.4% | 4.9% |
| Interquartile 75% (IQ3) | 37.3% | 6.3% |
| Interquartile Range (IQR) | 28.9% | 1.4% |
| Standard Deviation (Sample) | 30.1% | 2.0% |
| Standard Deviation (Population) | 29.3% | 2.0% |
Similar Demographics by Unemployment Among Ages 30 to 34 years
Demographics Similar to Pima by Unemployment Among Ages 30 to 34 years
In terms of unemployment among ages 30 to 34 years, the demographic groups most similar to Pima are Yakama (9.8%, a difference of 1.1%), Tohono O'odham (9.8%, a difference of 1.9%), Colville (9.0%, a difference of 6.7%), Crow (10.3%, a difference of 7.2%), and Puerto Rican (8.9%, a difference of 8.7%).
| Demographics | Rating | Rank | Unemployment Among Ages 30 to 34 years |
| Shoshone | 0.0 /100 | #330 | Tragic 7.9% |
| Sioux | 0.0 /100 | #331 | Tragic 8.0% |
| Natives/Alaskans | 0.0 /100 | #332 | Tragic 8.2% |
| Pueblo | 0.0 /100 | #333 | Tragic 8.3% |
| Alaska Natives | 0.0 /100 | #334 | Tragic 8.5% |
| Puerto Ricans | 0.0 /100 | #335 | Tragic 8.9% |
| Colville | 0.0 /100 | #336 | Tragic 9.0% |
| Pima | 0.0 /100 | #337 | Tragic 9.6% |
| Yakama | 0.0 /100 | #338 | Tragic 9.8% |
| Tohono O'odham | 0.0 /100 | #339 | Tragic 9.8% |
| Crow | 0.0 /100 | #340 | Tragic 10.3% |
| Navajo | 0.0 /100 | #341 | Tragic 10.6% |
| Yuman | 0.0 /100 | #342 | Tragic 10.6% |
| Inupiat | 0.0 /100 | #343 | Tragic 10.8% |
| Hopi | 0.0 /100 | #344 | Tragic 11.9% |
Demographics Similar to Immigrants from South America by Unemployment Among Ages 30 to 34 years
In terms of unemployment among ages 30 to 34 years, the demographic groups most similar to Immigrants from South America are Finnish (5.5%, a difference of 0.070%), Immigrants from Nicaragua (5.5%, a difference of 0.080%), Slavic (5.5%, a difference of 0.090%), Immigrants from Africa (5.5%, a difference of 0.10%), and Irish (5.5%, a difference of 0.12%).
| Demographics | Rating | Rank | Unemployment Among Ages 30 to 34 years |
| Immigrants | England | 35.7 /100 | #189 | Fair 5.5% |
| Immigrants | Kazakhstan | 33.9 /100 | #190 | Fair 5.5% |
| Irish | 31.3 /100 | #191 | Fair 5.5% |
| Moroccans | 31.2 /100 | #192 | Fair 5.5% |
| Immigrants | Africa | 31.0 /100 | #193 | Fair 5.5% |
| Slavs | 30.9 /100 | #194 | Fair 5.5% |
| Finns | 30.7 /100 | #195 | Fair 5.5% |
| Immigrants | South America | 29.8 /100 | #196 | Fair 5.5% |
| Immigrants | Nicaragua | 28.9 /100 | #197 | Fair 5.5% |
| Immigrants | Afghanistan | 27.2 /100 | #198 | Fair 5.6% |
| Nicaraguans | 26.6 /100 | #199 | Fair 5.6% |
| Immigrants | Southern Europe | 25.8 /100 | #200 | Fair 5.6% |
| South American Indians | 24.4 /100 | #201 | Fair 5.6% |
| Immigrants | Germany | 22.9 /100 | #202 | Fair 5.6% |
| Koreans | 20.7 /100 | #203 | Fair 5.6% |