Pima vs Guatemalan Unemployment Among Seniors over 65 years
COMPARE
Pima
Guatemalan
Unemployment Among Seniors over 65 years
Unemployment Among Seniors over 65 years Comparison
Pima
Guatemalans
6.3%
UNEMPLOYMENT AMONG SENIORS OVER 65 YEARS
0.0/ 100
METRIC RATING
336th/ 347
METRIC RANK
5.6%
UNEMPLOYMENT AMONG SENIORS OVER 65 YEARS
0.0/ 100
METRIC RATING
302nd/ 347
METRIC RANK
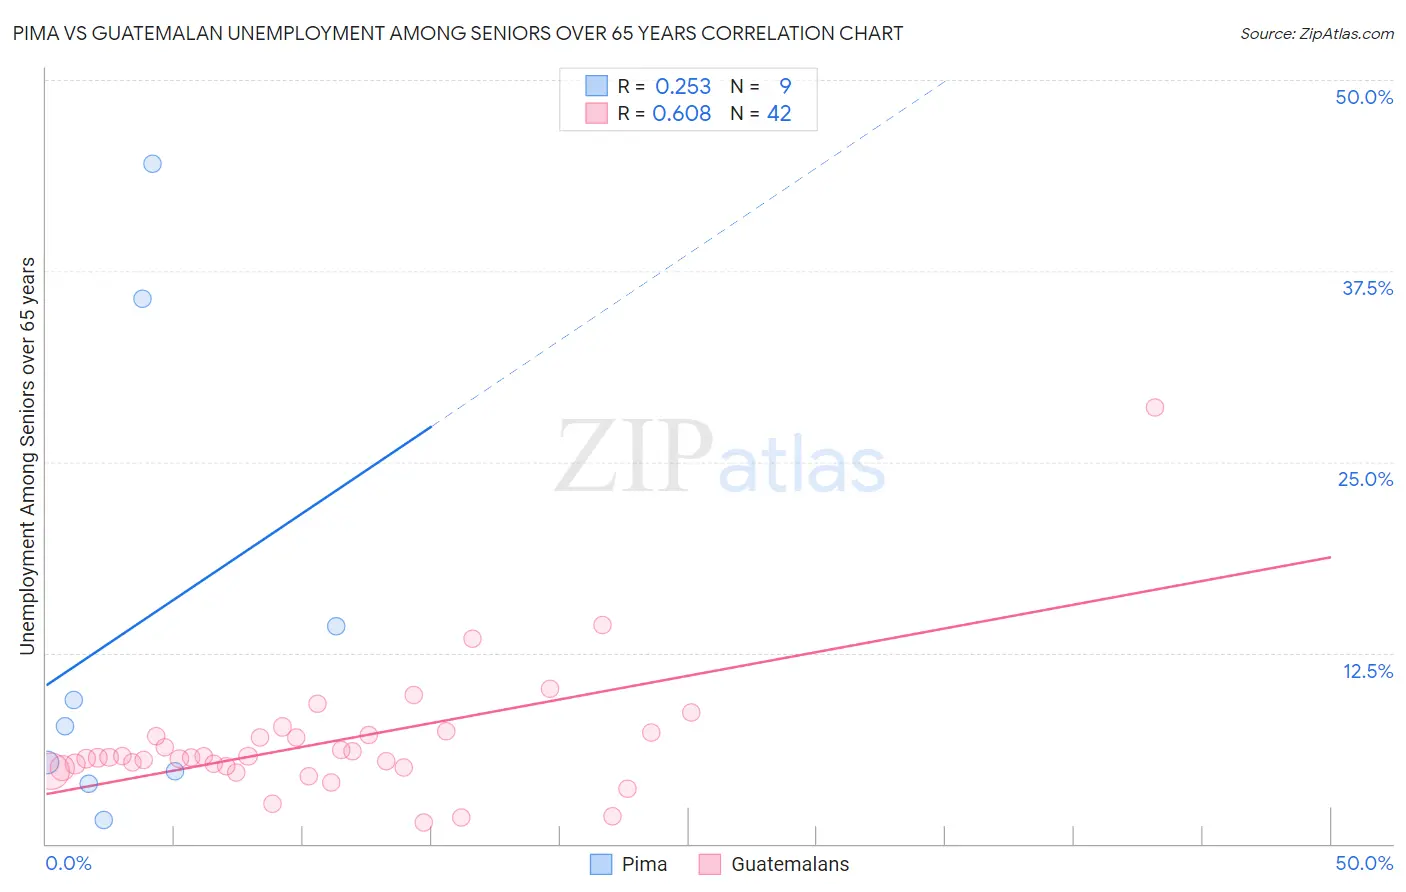
Pima vs Guatemalan Unemployment Among Seniors over 65 years Correlation Chart
The statistical analysis conducted on geographies consisting of 60,249,578 people shows a weak positive correlation between the proportion of Pima and unemployment rate amomg seniors over the age of 65 in the United States with a correlation coefficient (R) of 0.253 and weighted average of 6.3%. Similarly, the statistical analysis conducted on geographies consisting of 366,813,934 people shows a significant positive correlation between the proportion of Guatemalans and unemployment rate amomg seniors over the age of 65 in the United States with a correlation coefficient (R) of 0.608 and weighted average of 5.6%, a difference of 12.3%.
Unemployment Among Seniors over 65 years Correlation Summary
| Measurement | Pima | Guatemalan |
| Minimum | 1.6% | 1.4% |
| Maximum | 44.5% | 28.6% |
| Range | 42.9% | 27.2% |
| Mean | 14.1% | 6.6% |
| Median | 7.7% | 5.7% |
| Interquartile 25% (IQ1) | 4.3% | 5.0% |
| Interquartile 75% (IQ3) | 24.9% | 7.1% |
| Interquartile Range (IQR) | 20.6% | 2.1% |
| Standard Deviation (Sample) | 15.3% | 4.3% |
| Standard Deviation (Population) | 14.4% | 4.3% |
Similar Demographics by Unemployment Among Seniors over 65 years
Demographics Similar to Pima by Unemployment Among Seniors over 65 years
In terms of unemployment among seniors over 65 years, the demographic groups most similar to Pima are Alaska Native (6.3%, a difference of 0.55%), Immigrants from the Azores (6.3%, a difference of 0.72%), Paiute (6.3%, a difference of 0.99%), Ute (6.3%, a difference of 1.1%), and Immigrants from Armenia (6.2%, a difference of 1.8%).
| Demographics | Rating | Rank | Unemployment Among Seniors over 65 years |
| Dominicans | 0.0 /100 | #329 | Tragic 6.0% |
| Immigrants | Portugal | 0.0 /100 | #330 | Tragic 6.0% |
| Taiwanese | 0.0 /100 | #331 | Tragic 6.0% |
| Aleuts | 0.0 /100 | #332 | Tragic 6.0% |
| Immigrants | Dominican Republic | 0.0 /100 | #333 | Tragic 6.0% |
| Tohono O'odham | 0.0 /100 | #334 | Tragic 6.1% |
| Immigrants | Armenia | 0.0 /100 | #335 | Tragic 6.2% |
| Pima | 0.0 /100 | #336 | Tragic 6.3% |
| Alaska Natives | 0.0 /100 | #337 | Tragic 6.3% |
| Immigrants | Azores | 0.0 /100 | #338 | Tragic 6.3% |
| Paiute | 0.0 /100 | #339 | Tragic 6.3% |
| Ute | 0.0 /100 | #340 | Tragic 6.3% |
| Yakama | 0.0 /100 | #341 | Tragic 6.7% |
| Navajo | 0.0 /100 | #342 | Tragic 6.7% |
| Tlingit-Haida | 0.0 /100 | #343 | Tragic 6.8% |
Demographics Similar to Guatemalans by Unemployment Among Seniors over 65 years
In terms of unemployment among seniors over 65 years, the demographic groups most similar to Guatemalans are Immigrants from Latin America (5.6%, a difference of 0.090%), Hispanic or Latino (5.6%, a difference of 0.16%), Liberian (5.6%, a difference of 0.17%), Mexican (5.6%, a difference of 0.33%), and Zimbabwean (5.6%, a difference of 0.37%).
| Demographics | Rating | Rank | Unemployment Among Seniors over 65 years |
| Cheyenne | 0.0 /100 | #295 | Tragic 5.5% |
| Cape Verdeans | 0.0 /100 | #296 | Tragic 5.5% |
| Yaqui | 0.0 /100 | #297 | Tragic 5.5% |
| Immigrants | West Indies | 0.0 /100 | #298 | Tragic 5.6% |
| Guyanese | 0.0 /100 | #299 | Tragic 5.6% |
| Zimbabweans | 0.0 /100 | #300 | Tragic 5.6% |
| Hispanics or Latinos | 0.0 /100 | #301 | Tragic 5.6% |
| Guatemalans | 0.0 /100 | #302 | Tragic 5.6% |
| Immigrants | Latin America | 0.0 /100 | #303 | Tragic 5.6% |
| Liberians | 0.0 /100 | #304 | Tragic 5.6% |
| Mexicans | 0.0 /100 | #305 | Tragic 5.6% |
| Ecuadorians | 0.0 /100 | #306 | Tragic 5.6% |
| Portuguese | 0.0 /100 | #307 | Tragic 5.6% |
| Immigrants | St. Vincent and the Grenadines | 0.0 /100 | #308 | Tragic 5.6% |
| Immigrants | Guatemala | 0.0 /100 | #309 | Tragic 5.6% |