Pennsylvania German vs Iranian Unemployment Among Ages 55 to 59 years
COMPARE
Pennsylvania German
Iranian
Unemployment Among Ages 55 to 59 years
Unemployment Among Ages 55 to 59 years Comparison
Pennsylvania Germans
Iranians
4.7%
UNEMPLOYMENT AMONG AGES 55 TO 59 YEARS
87.1/ 100
METRIC RATING
128th/ 347
METRIC RANK
4.9%
UNEMPLOYMENT AMONG AGES 55 TO 59 YEARS
32.4/ 100
METRIC RATING
191st/ 347
METRIC RANK
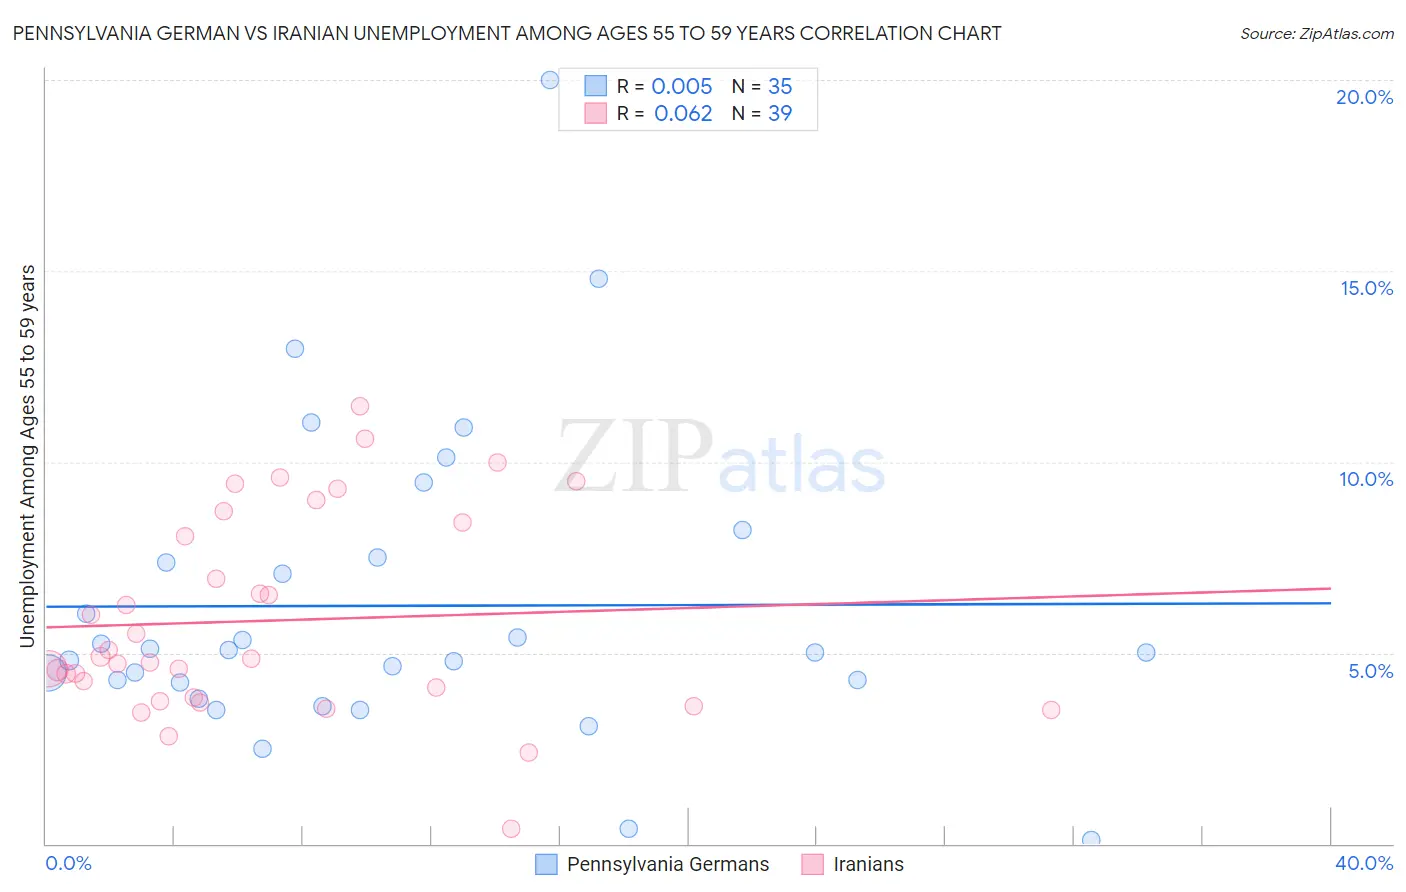
Pennsylvania German vs Iranian Unemployment Among Ages 55 to 59 years Correlation Chart
The statistical analysis conducted on geographies consisting of 218,034,331 people shows no correlation between the proportion of Pennsylvania Germans and unemployment rate among population between the ages 55 and 59 in the United States with a correlation coefficient (R) of 0.005 and weighted average of 4.7%. Similarly, the statistical analysis conducted on geographies consisting of 301,275,833 people shows a slight positive correlation between the proportion of Iranians and unemployment rate among population between the ages 55 and 59 in the United States with a correlation coefficient (R) of 0.062 and weighted average of 4.9%, a difference of 2.7%.
Unemployment Among Ages 55 to 59 years Correlation Summary
| Measurement | Pennsylvania German | Iranian |
| Minimum | 0.10% | 0.40% |
| Maximum | 20.0% | 11.5% |
| Range | 19.9% | 11.1% |
| Mean | 6.2% | 5.8% |
| Median | 5.0% | 4.9% |
| Interquartile 25% (IQ1) | 4.2% | 3.8% |
| Interquartile 75% (IQ3) | 7.5% | 8.4% |
| Interquartile Range (IQR) | 3.3% | 4.6% |
| Standard Deviation (Sample) | 4.0% | 2.6% |
| Standard Deviation (Population) | 3.9% | 2.6% |
Similar Demographics by Unemployment Among Ages 55 to 59 years
Demographics Similar to Pennsylvania Germans by Unemployment Among Ages 55 to 59 years
In terms of unemployment among ages 55 to 59 years, the demographic groups most similar to Pennsylvania Germans are Immigrants from Sweden (4.7%, a difference of 0.030%), Greek (4.7%, a difference of 0.040%), Icelander (4.7%, a difference of 0.050%), Immigrants from Serbia (4.7%, a difference of 0.060%), and Immigrants from Malaysia (4.7%, a difference of 0.080%).
| Demographics | Rating | Rank | Unemployment Among Ages 55 to 59 years |
| Pakistanis | 89.7 /100 | #121 | Excellent 4.7% |
| Immigrants | Afghanistan | 89.5 /100 | #122 | Excellent 4.7% |
| Immigrants | Japan | 89.4 /100 | #123 | Excellent 4.7% |
| Lithuanians | 88.8 /100 | #124 | Excellent 4.7% |
| Immigrants | Malaysia | 87.9 /100 | #125 | Excellent 4.7% |
| Immigrants | Serbia | 87.8 /100 | #126 | Excellent 4.7% |
| Icelanders | 87.7 /100 | #127 | Excellent 4.7% |
| Pennsylvania Germans | 87.1 /100 | #128 | Excellent 4.7% |
| Immigrants | Sweden | 86.8 /100 | #129 | Excellent 4.7% |
| Greeks | 86.6 /100 | #130 | Excellent 4.7% |
| Immigrants | Thailand | 85.4 /100 | #131 | Excellent 4.7% |
| Immigrants | Romania | 85.3 /100 | #132 | Excellent 4.7% |
| Immigrants | Netherlands | 84.5 /100 | #133 | Excellent 4.7% |
| Panamanians | 84.1 /100 | #134 | Excellent 4.7% |
| Slavs | 83.7 /100 | #135 | Excellent 4.7% |
Demographics Similar to Iranians by Unemployment Among Ages 55 to 59 years
In terms of unemployment among ages 55 to 59 years, the demographic groups most similar to Iranians are Immigrants from Ukraine (4.9%, a difference of 0.040%), Russian (4.9%, a difference of 0.070%), Iroquois (4.9%, a difference of 0.090%), Immigrants from Italy (4.9%, a difference of 0.11%), and Immigrants from Eastern Asia (4.8%, a difference of 0.16%).
| Demographics | Rating | Rank | Unemployment Among Ages 55 to 59 years |
| Immigrants | Czechoslovakia | 38.0 /100 | #184 | Fair 4.8% |
| Peruvians | 37.0 /100 | #185 | Fair 4.8% |
| Osage | 37.0 /100 | #186 | Fair 4.8% |
| Immigrants | Morocco | 36.5 /100 | #187 | Fair 4.8% |
| Immigrants | Eastern Asia | 36.1 /100 | #188 | Fair 4.8% |
| Iroquois | 34.5 /100 | #189 | Fair 4.9% |
| Russians | 33.9 /100 | #190 | Fair 4.9% |
| Iranians | 32.4 /100 | #191 | Fair 4.9% |
| Immigrants | Ukraine | 31.7 /100 | #192 | Fair 4.9% |
| Immigrants | Italy | 30.1 /100 | #193 | Fair 4.9% |
| Spaniards | 27.2 /100 | #194 | Fair 4.9% |
| Estonians | 27.2 /100 | #195 | Fair 4.9% |
| Eastern Europeans | 26.7 /100 | #196 | Fair 4.9% |
| Macedonians | 26.4 /100 | #197 | Fair 4.9% |
| Immigrants | Philippines | 26.1 /100 | #198 | Fair 4.9% |