Pennsylvania German vs Immigrants from Micronesia Unemployment Among Ages 16 to 19 years
COMPARE
Pennsylvania German
Immigrants from Micronesia
Unemployment Among Ages 16 to 19 years
Unemployment Among Ages 16 to 19 years Comparison
Pennsylvania Germans
Immigrants from Micronesia
16.2%
UNEMPLOYMENT AMONG AGES 16 TO 19 YEARS
99.9/ 100
METRIC RATING
34th/ 347
METRIC RANK
17.6%
UNEMPLOYMENT AMONG AGES 16 TO 19 YEARS
42.4/ 100
METRIC RATING
187th/ 347
METRIC RANK
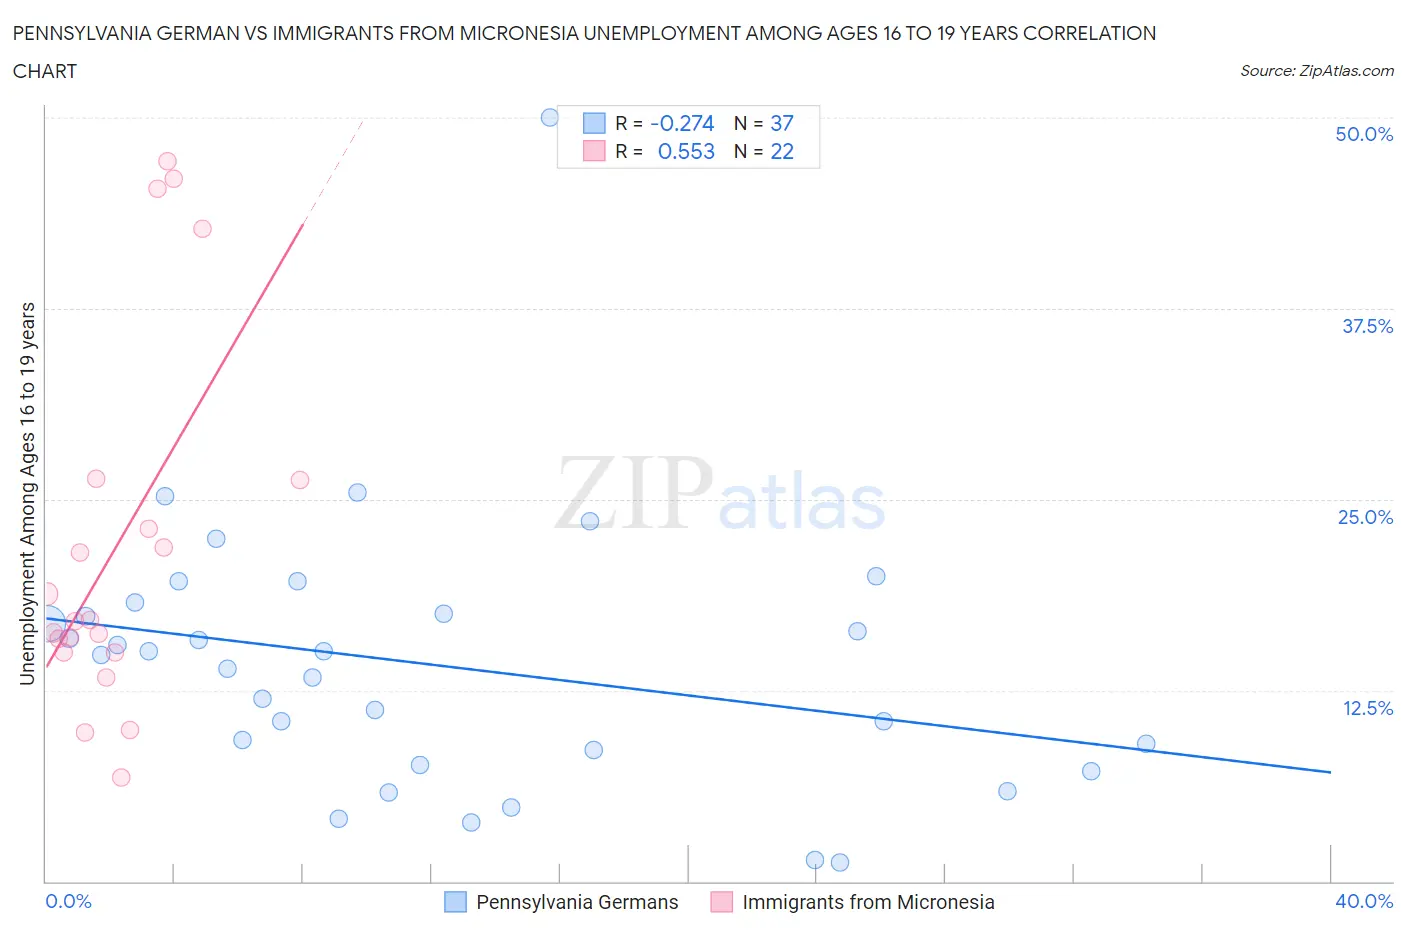
Pennsylvania German vs Immigrants from Micronesia Unemployment Among Ages 16 to 19 years Correlation Chart
The statistical analysis conducted on geographies consisting of 221,699,953 people shows a weak negative correlation between the proportion of Pennsylvania Germans and unemployment rate among population between the ages 16 and 19 in the United States with a correlation coefficient (R) of -0.274 and weighted average of 16.2%. Similarly, the statistical analysis conducted on geographies consisting of 60,570,430 people shows a substantial positive correlation between the proportion of Immigrants from Micronesia and unemployment rate among population between the ages 16 and 19 in the United States with a correlation coefficient (R) of 0.553 and weighted average of 17.6%, a difference of 8.8%.
Unemployment Among Ages 16 to 19 years Correlation Summary
| Measurement | Pennsylvania German | Immigrants from Micronesia |
| Minimum | 1.2% | 6.8% |
| Maximum | 50.0% | 47.1% |
| Range | 48.8% | 40.3% |
| Mean | 14.2% | 22.1% |
| Median | 14.8% | 17.0% |
| Interquartile 25% (IQ1) | 8.1% | 15.0% |
| Interquartile 75% (IQ3) | 17.9% | 26.3% |
| Interquartile Range (IQR) | 9.8% | 11.3% |
| Standard Deviation (Sample) | 8.9% | 12.2% |
| Standard Deviation (Population) | 8.7% | 11.9% |
Similar Demographics by Unemployment Among Ages 16 to 19 years
Demographics Similar to Pennsylvania Germans by Unemployment Among Ages 16 to 19 years
In terms of unemployment among ages 16 to 19 years, the demographic groups most similar to Pennsylvania Germans are Immigrants from Kenya (16.2%, a difference of 0.030%), Scottish (16.2%, a difference of 0.15%), Immigrants from South Central Asia (16.2%, a difference of 0.16%), Immigrants from Congo (16.3%, a difference of 0.27%), and Bulgarian (16.3%, a difference of 0.28%).
| Demographics | Rating | Rank | Unemployment Among Ages 16 to 19 years |
| Immigrants | Sudan | 99.9 /100 | #27 | Exceptional 16.0% |
| Jordanians | 99.9 /100 | #28 | Exceptional 16.0% |
| Chinese | 99.9 /100 | #29 | Exceptional 16.0% |
| Kenyans | 99.9 /100 | #30 | Exceptional 16.1% |
| English | 99.9 /100 | #31 | Exceptional 16.1% |
| Europeans | 99.9 /100 | #32 | Exceptional 16.1% |
| Immigrants | Kenya | 99.9 /100 | #33 | Exceptional 16.2% |
| Pennsylvania Germans | 99.9 /100 | #34 | Exceptional 16.2% |
| Scottish | 99.8 /100 | #35 | Exceptional 16.2% |
| Immigrants | South Central Asia | 99.8 /100 | #36 | Exceptional 16.2% |
| Immigrants | Congo | 99.8 /100 | #37 | Exceptional 16.3% |
| Bulgarians | 99.8 /100 | #38 | Exceptional 16.3% |
| Croatians | 99.8 /100 | #39 | Exceptional 16.3% |
| Hmong | 99.8 /100 | #40 | Exceptional 16.3% |
| Immigrants | Nepal | 99.8 /100 | #41 | Exceptional 16.3% |
Demographics Similar to Immigrants from Micronesia by Unemployment Among Ages 16 to 19 years
In terms of unemployment among ages 16 to 19 years, the demographic groups most similar to Immigrants from Micronesia are Immigrants from Nicaragua (17.6%, a difference of 0.010%), Immigrants from Europe (17.6%, a difference of 0.030%), Marshallese (17.6%, a difference of 0.030%), Japanese (17.6%, a difference of 0.040%), and Iroquois (17.6%, a difference of 0.050%).
| Demographics | Rating | Rank | Unemployment Among Ages 16 to 19 years |
| Spaniards | 47.1 /100 | #180 | Average 17.6% |
| Immigrants | Turkey | 45.6 /100 | #181 | Average 17.6% |
| Russians | 45.2 /100 | #182 | Average 17.6% |
| Immigrants | Uruguay | 44.6 /100 | #183 | Average 17.6% |
| Eastern Europeans | 44.3 /100 | #184 | Average 17.6% |
| Iroquois | 43.4 /100 | #185 | Average 17.6% |
| Japanese | 43.2 /100 | #186 | Average 17.6% |
| Immigrants | Micronesia | 42.4 /100 | #187 | Average 17.6% |
| Immigrants | Nicaragua | 42.2 /100 | #188 | Average 17.6% |
| Immigrants | Europe | 41.8 /100 | #189 | Average 17.6% |
| Marshallese | 41.7 /100 | #190 | Average 17.6% |
| Immigrants | Costa Rica | 41.3 /100 | #191 | Average 17.6% |
| Immigrants | Philippines | 40.7 /100 | #192 | Average 17.7% |
| Immigrants | Australia | 40.6 /100 | #193 | Average 17.7% |
| Peruvians | 38.8 /100 | #194 | Fair 17.7% |