Pennsylvania German vs Immigrants from Ecuador Unemployment Among Ages 45 to 54 years
COMPARE
Pennsylvania German
Immigrants from Ecuador
Unemployment Among Ages 45 to 54 years
Unemployment Among Ages 45 to 54 years Comparison
Pennsylvania Germans
Immigrants from Ecuador
4.3%
UNEMPLOYMENT AMONG AGES 45 TO 54 YEARS
99.1/ 100
METRIC RATING
63rd/ 347
METRIC RANK
5.3%
UNEMPLOYMENT AMONG AGES 45 TO 54 YEARS
0.0/ 100
METRIC RATING
302nd/ 347
METRIC RANK
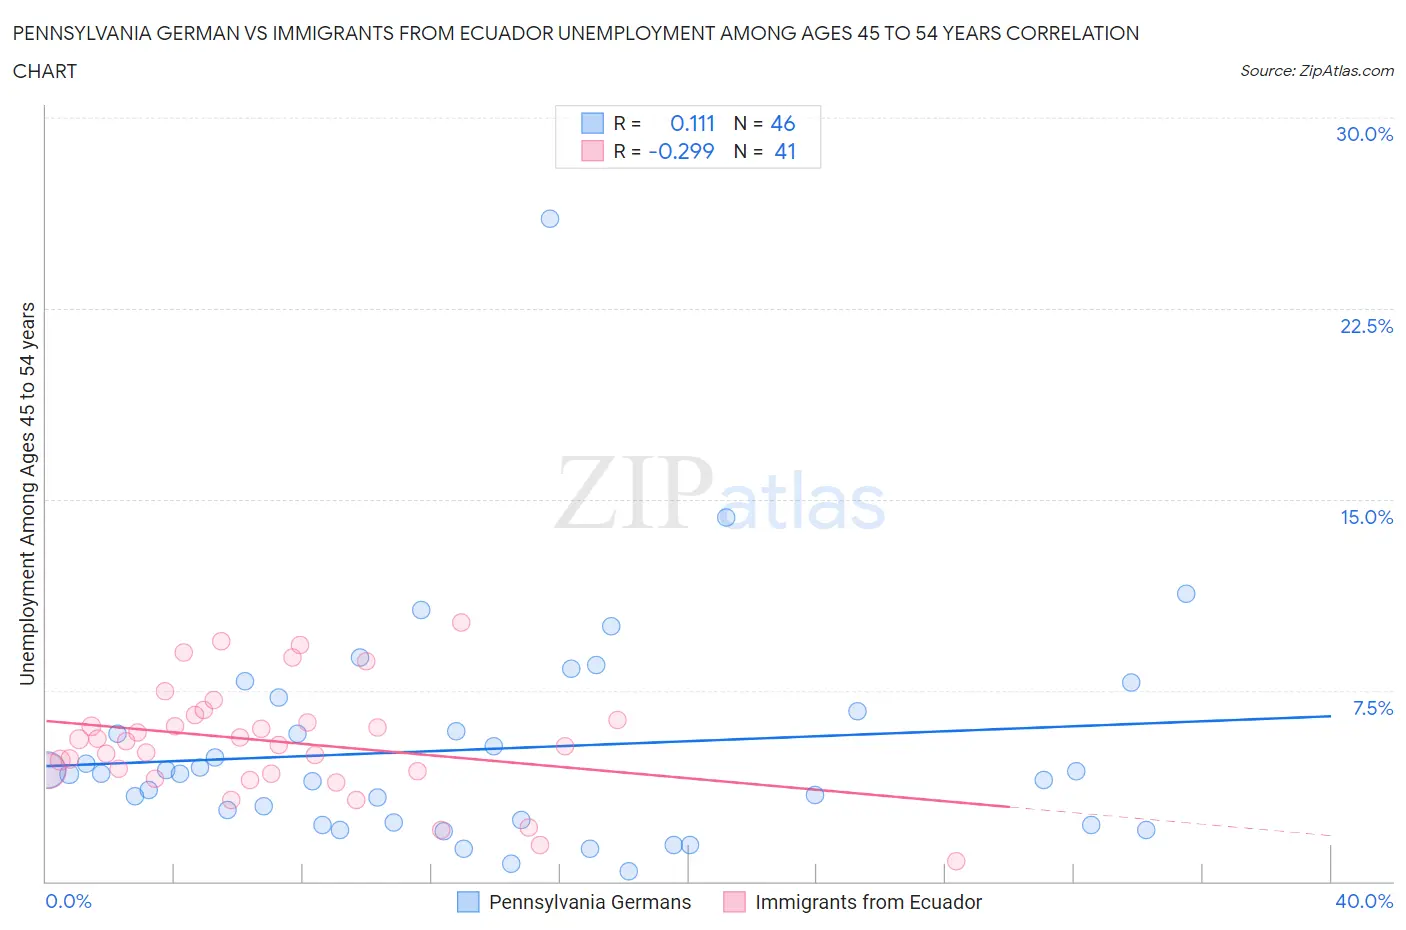
Pennsylvania German vs Immigrants from Ecuador Unemployment Among Ages 45 to 54 years Correlation Chart
The statistical analysis conducted on geographies consisting of 227,074,394 people shows a poor positive correlation between the proportion of Pennsylvania Germans and unemployment rate among population between the ages 45 and 54 in the United States with a correlation coefficient (R) of 0.111 and weighted average of 4.3%. Similarly, the statistical analysis conducted on geographies consisting of 267,492,457 people shows a weak negative correlation between the proportion of Immigrants from Ecuador and unemployment rate among population between the ages 45 and 54 in the United States with a correlation coefficient (R) of -0.299 and weighted average of 5.3%, a difference of 24.9%.
Unemployment Among Ages 45 to 54 years Correlation Summary
| Measurement | Pennsylvania German | Immigrants from Ecuador |
| Minimum | 0.40% | 0.80% |
| Maximum | 26.0% | 10.1% |
| Range | 25.6% | 9.3% |
| Mean | 5.2% | 5.5% |
| Median | 4.2% | 5.5% |
| Interquartile 25% (IQ1) | 2.3% | 4.3% |
| Interquartile 75% (IQ3) | 6.7% | 6.4% |
| Interquartile Range (IQR) | 4.4% | 2.2% |
| Standard Deviation (Sample) | 4.4% | 2.1% |
| Standard Deviation (Population) | 4.3% | 2.1% |
Similar Demographics by Unemployment Among Ages 45 to 54 years
Demographics Similar to Pennsylvania Germans by Unemployment Among Ages 45 to 54 years
In terms of unemployment among ages 45 to 54 years, the demographic groups most similar to Pennsylvania Germans are Lithuanian (4.3%, a difference of 0.090%), Austrian (4.3%, a difference of 0.10%), Immigrants from Sudan (4.3%, a difference of 0.13%), Turkish (4.3%, a difference of 0.17%), and Immigrants from Nepal (4.3%, a difference of 0.19%).
| Demographics | Rating | Rank | Unemployment Among Ages 45 to 54 years |
| Immigrants | Jordan | 99.3 /100 | #56 | Exceptional 4.3% |
| Immigrants | Sri Lanka | 99.3 /100 | #57 | Exceptional 4.3% |
| Greeks | 99.3 /100 | #58 | Exceptional 4.3% |
| Okinawans | 99.2 /100 | #59 | Exceptional 4.3% |
| Immigrants | Korea | 99.2 /100 | #60 | Exceptional 4.3% |
| Immigrants | Pakistan | 99.2 /100 | #61 | Exceptional 4.3% |
| Lithuanians | 99.1 /100 | #62 | Exceptional 4.3% |
| Pennsylvania Germans | 99.1 /100 | #63 | Exceptional 4.3% |
| Austrians | 99.0 /100 | #64 | Exceptional 4.3% |
| Immigrants | Sudan | 99.0 /100 | #65 | Exceptional 4.3% |
| Turks | 98.9 /100 | #66 | Exceptional 4.3% |
| Immigrants | Nepal | 98.9 /100 | #67 | Exceptional 4.3% |
| Slovaks | 98.8 /100 | #68 | Exceptional 4.3% |
| Immigrants | Japan | 98.7 /100 | #69 | Exceptional 4.3% |
| Paraguayans | 98.6 /100 | #70 | Exceptional 4.3% |
Demographics Similar to Immigrants from Ecuador by Unemployment Among Ages 45 to 54 years
In terms of unemployment among ages 45 to 54 years, the demographic groups most similar to Immigrants from Ecuador are Immigrants from Belize (5.3%, a difference of 0.10%), Immigrants from Jamaica (5.4%, a difference of 0.27%), Immigrants from West Indies (5.4%, a difference of 0.45%), Immigrants from Bangladesh (5.4%, a difference of 0.61%), and Menominee (5.3%, a difference of 0.85%).
| Demographics | Rating | Rank | Unemployment Among Ages 45 to 54 years |
| Jamaicans | 0.0 /100 | #295 | Tragic 5.3% |
| Aleuts | 0.0 /100 | #296 | Tragic 5.3% |
| West Indians | 0.0 /100 | #297 | Tragic 5.3% |
| Immigrants | Trinidad and Tobago | 0.0 /100 | #298 | Tragic 5.3% |
| Ecuadorians | 0.0 /100 | #299 | Tragic 5.3% |
| Central American Indians | 0.0 /100 | #300 | Tragic 5.3% |
| Menominee | 0.0 /100 | #301 | Tragic 5.3% |
| Immigrants | Ecuador | 0.0 /100 | #302 | Tragic 5.3% |
| Immigrants | Belize | 0.0 /100 | #303 | Tragic 5.3% |
| Immigrants | Jamaica | 0.0 /100 | #304 | Tragic 5.4% |
| Immigrants | West Indies | 0.0 /100 | #305 | Tragic 5.4% |
| Immigrants | Bangladesh | 0.0 /100 | #306 | Tragic 5.4% |
| Vietnamese | 0.0 /100 | #307 | Tragic 5.4% |
| Blacks/African Americans | 0.0 /100 | #308 | Tragic 5.4% |
| Barbadians | 0.0 /100 | #309 | Tragic 5.5% |