Paraguayan vs Immigrants from Mexico Unemployment Among Ages 35 to 44 years

COMPARE

Paraguayan
Race
Ancestry
AfghanAfricanAlaska NativeAlaskan AthabascanAlbanianAleutAlsatianAmericanApacheArabArapahoArgentineanArmenianAssyrian/Chaldean/SyriacAustralianAustrianBahamianBangladeshiBarbadianBasqueBelgianBelizeanBermudanBhutaneseBlackfeetBolivianBrazilianBritishBritish West IndianBulgarianBurmeseCajunCambodianCanadianCape VerdeanCarpatho RusynCelticCentral AmericanCentral American IndianCherokeeCheyenneChickasawChileanChineseChippewaChoctawColombianColvilleComancheCosta RicanCreeCreekCroatianCrowCubanCypriotCzechCzechoslovakianDanishDelawareDominicanDutchDutch West IndianEastern EuropeanEcuadorianEgyptianEnglishEstonianEthiopianEuropeanFijianFilipinoFinnishFrenchFrench American IndianFrench CanadianGermanGerman RussianGhanaianGreekGuamanian/ChamorroGuatemalanGuyaneseHaitianHmongHonduranHopiHoumaHungarianIcelanderIndian (Asian)IndonesianInupiatIranianIraqiIrishIroquoisIsraeliItalianJamaicanJapaneseJordanianKenyanKiowaKoreanLaotianLatvianLebaneseLiberianLithuanianLumbeeLuxembourgerMacedonianMalaysianMalteseMarshalleseMenomineeMexicanMexican American IndianMongolianMoroccanNative HawaiianNavajoNepaleseNew ZealanderNicaraguanNigerianNorthern EuropeanNorwegianOkinawanOsageOttawaPaiutePakistaniPalestinianPanamanianParaguayanPennsylvania GermanPeruvianPimaPolishPortuguesePotawatomiPuebloPuerto RicanPuget Sound SalishRomanianRussianSalvadoranSamoanScandinavianScotch-IrishScottishSeminoleSenegaleseSerbianShoshoneSierra LeoneanSiouxSlavicSlovakSloveneSomaliSouth AfricanSouth AmericanSouth American IndianSoviet UnionSpaniardSpanishSpanish AmericanSpanish American IndianSri LankanSubsaharan AfricanSudaneseSwedishSwissSyrianTaiwaneseThaiTlingit-HaidaTohono O'OdhamTonganTrinidadian and TobagonianTsimshianTurkishU.S. Virgin IslanderUgandanUkrainianUruguayanUteVenezuelanVietnameseWelshWest IndianYakamaYaquiYugoslavianYumanYup'ikZimbabwean
Immigration
NonimmigrantsImmigrantsAfghanistanAfricaAlbaniaArgentinaArmeniaAsiaAustraliaAustriaBahamasBangladeshBarbadosBelarusBelgiumBelizeBoliviaBosnia and HerzegovinaBrazilBulgariaBurma/MyanmarCabo VerdeCambodiaCameroonCanadaCaribbeanCentral AmericaChileChinaColombiaCongoCosta RicaCroatiaCubaCzechoslovakiaDenmarkDominicaDominican RepublicEastern AfricaEastern AsiaEastern EuropeEcuadorEgyptEl SalvadorEnglandEritreaEthiopiaEuropeFijiFranceGermanyGhanaGreeceGrenadaGuatemalaGuyanaHaitiHondurasHong KongHungaryIndiaIndonesiaIranIraqIrelandIsraelItalyJamaicaJapanJordanKazakhstanKenyaKoreaKuwaitLaosLatin AmericaLatviaLebanonLiberiaLithuaniaMalaysiaMicronesiaMiddle AfricaMoldovaMoroccoNepalNetherlandsNicaraguaNigeriaNorth AmericaNorth MacedoniaNorthern AfricaNorthern EuropeNorwayOceaniaPakistanPanamaPeruPhilippinesPolandPortugalRomaniaRussiaSaudi ArabiaScotlandSenegalSerbiaSierra LeoneSingaporeSomaliaSouth AfricaSouth AmericaSouth Central AsiaSouth Eastern AsiaSouthern EuropeSpainSri LankaSt. Vincent and the GrenadinesSudanSwedenSwitzerlandSyriaTaiwanThailandTrinidad and TobagoTurkeyUgandaUkraineUruguayUzbekistanVenezuelaVietnamWest IndiesWestern AfricaWestern AsiaWestern EuropeYemenZaireZimbabweAzores
Immigrants from Mexico
Race
Ancestry
AfghanAfricanAlaska NativeAlaskan AthabascanAlbanianAleutAlsatianAmericanApacheArabArapahoArgentineanArmenianAssyrian/Chaldean/SyriacAustralianAustrianBahamianBangladeshiBarbadianBasqueBelgianBelizeanBermudanBhutaneseBlackfeetBolivianBrazilianBritishBritish West IndianBulgarianBurmeseCajunCambodianCanadianCape VerdeanCarpatho RusynCelticCentral AmericanCentral American IndianCherokeeCheyenneChickasawChileanChineseChippewaChoctawColombianColvilleComancheCosta RicanCreeCreekCroatianCrowCubanCypriotCzechCzechoslovakianDanishDelawareDominicanDutchDutch West IndianEastern EuropeanEcuadorianEgyptianEnglishEstonianEthiopianEuropeanFijianFilipinoFinnishFrenchFrench American IndianFrench CanadianGermanGerman RussianGhanaianGreekGuamanian/ChamorroGuatemalanGuyaneseHaitianHmongHonduranHopiHoumaHungarianIcelanderIndian (Asian)IndonesianInupiatIranianIraqiIrishIroquoisIsraeliItalianJamaicanJapaneseJordanianKenyanKiowaKoreanLaotianLatvianLebaneseLiberianLithuanianLumbeeLuxembourgerMacedonianMalaysianMalteseMarshalleseMenomineeMexicanMexican American IndianMongolianMoroccanNative HawaiianNavajoNepaleseNew ZealanderNicaraguanNigerianNorthern EuropeanNorwegianOkinawanOsageOttawaPaiutePakistaniPalestinianPanamanianPennsylvania GermanPeruvianPimaPolishPortuguesePotawatomiPuebloPuerto RicanPuget Sound SalishRomanianRussianSalvadoranSamoanScandinavianScotch-IrishScottishSeminoleSenegaleseSerbianShoshoneSierra LeoneanSiouxSlavicSlovakSloveneSomaliSouth AfricanSouth AmericanSouth American IndianSoviet UnionSpaniardSpanishSpanish AmericanSpanish American IndianSri LankanSubsaharan AfricanSudaneseSwedishSwissSyrianTaiwaneseThaiTlingit-HaidaTohono O'OdhamTonganTrinidadian and TobagonianTsimshianTurkishU.S. Virgin IslanderUgandanUkrainianUruguayanUteVenezuelanVietnameseWelshWest IndianYakamaYaquiYugoslavianYumanYup'ikZimbabwean
Immigration
NonimmigrantsImmigrantsAfghanistanAfricaAlbaniaArgentinaArmeniaAsiaAustraliaAustriaBahamasBangladeshBarbadosBelarusBelgiumBelizeBoliviaBosnia and HerzegovinaBrazilBulgariaBurma/MyanmarCabo VerdeCambodiaCameroonCanadaCaribbeanCentral AmericaChileChinaColombiaCongoCosta RicaCroatiaCubaCzechoslovakiaDenmarkDominicaDominican RepublicEastern AfricaEastern AsiaEastern EuropeEcuadorEgyptEl SalvadorEnglandEritreaEthiopiaEuropeFijiFranceGermanyGhanaGreeceGrenadaGuatemalaGuyanaHaitiHondurasHong KongHungaryIndiaIndonesiaIranIraqIrelandIsraelItalyJamaicaJapanJordanKazakhstanKenyaKoreaKuwaitLaosLatin AmericaLatviaLebanonLiberiaLithuaniaMalaysiaMexicoMicronesiaMiddle AfricaMoldovaMoroccoNepalNetherlandsNicaraguaNigeriaNorth AmericaNorth MacedoniaNorthern AfricaNorthern EuropeNorwayOceaniaPakistanPanamaPeruPhilippinesPolandPortugalRomaniaRussiaSaudi ArabiaScotlandSenegalSerbiaSierra LeoneSingaporeSomaliaSouth AfricaSouth AmericaSouth Central AsiaSouth Eastern AsiaSouthern EuropeSpainSri LankaSt. Vincent and the GrenadinesSudanSwedenSwitzerlandSyriaTaiwanThailandTrinidad and TobagoTurkeyUgandaUkraineUruguayUzbekistanVenezuelaVietnamWest IndiesWestern AfricaWestern AsiaWestern EuropeYemenZaireZimbabweAzores
Unemployment Among Ages 35 to 44 years
Income
Poverty
Unemployment
Labor Participation
Family Structure
Vehicle Availability
Education Level
Disability

Unemployment Among Ages 35 to 44 years Comparison

Paraguayans

Immigrants from Mexico

Exceptional
Tragic
4.2%
UNEMPLOYMENT AMONG AGES 35 TO 44 YEARS
99.6/ 100
METRIC RATING
21st/ 347
METRIC RANK
5.4%
UNEMPLOYMENT AMONG AGES 35 TO 44 YEARS
0.0/ 100
METRIC RATING
275th/ 347
METRIC RANK

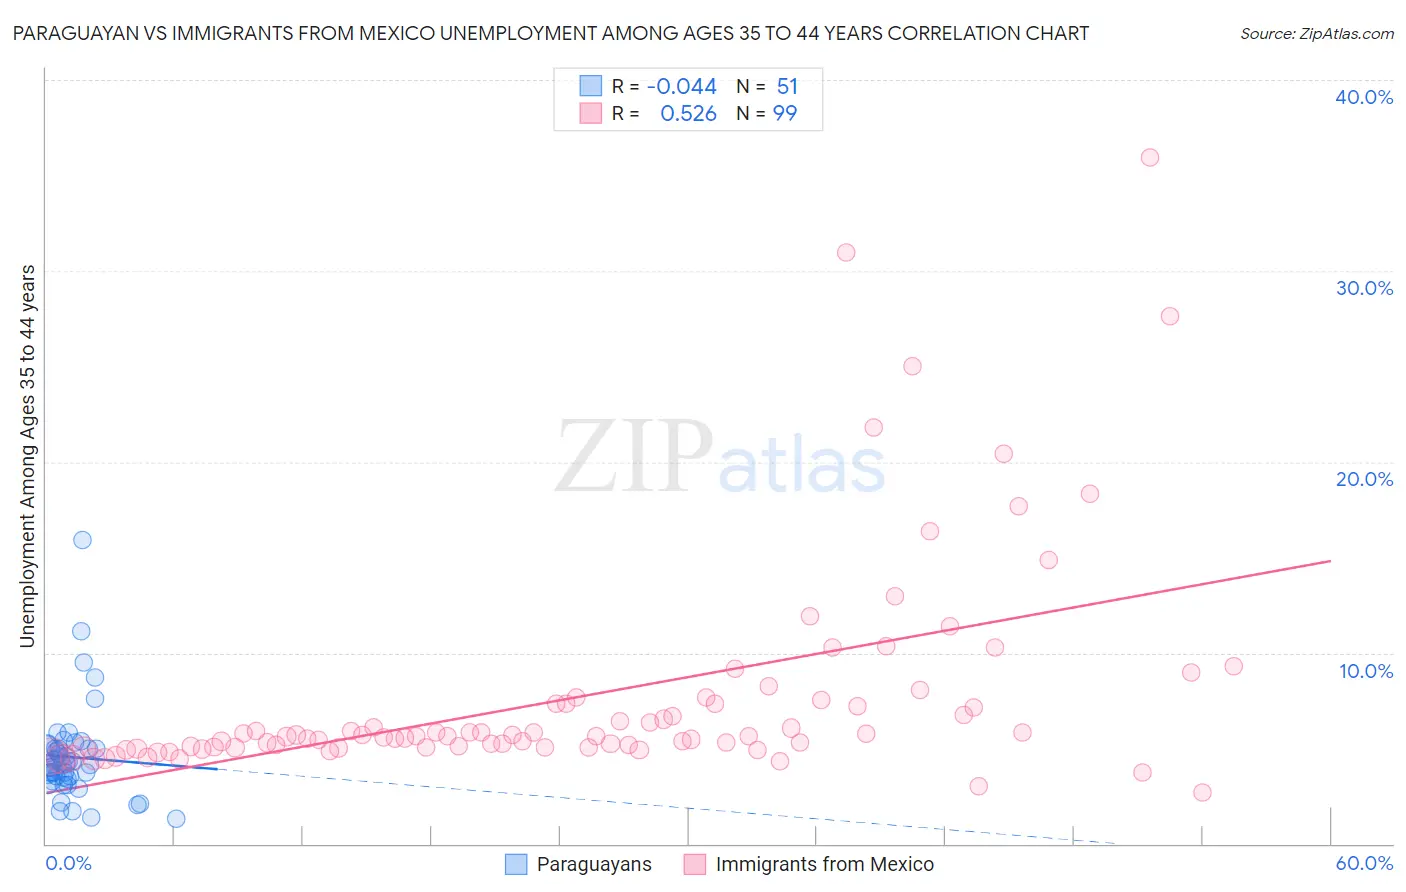
Paraguayan vs Immigrants from Mexico Unemployment Among Ages 35 to 44 years Correlation Chart

The statistical analysis conducted on geographies consisting of 94,565,213 people shows no correlation between the proportion of Paraguayans and unemployment rate among population between the ages 35 and 44 in the United States with a correlation coefficient (R) of -0.044 and weighted average of 4.2%. Similarly, the statistical analysis conducted on geographies consisting of 491,094,194 people shows a substantial positive correlation between the proportion of Immigrants from Mexico and unemployment rate among population between the ages 35 and 44 in the United States with a correlation coefficient (R) of 0.526 and weighted average of 5.4%, a difference of 26.6%.
Paraguayan vs Immigrants from Mexico Unemployment Among Ages 35 to 44 years

Unemployment Among Ages 35 to 44 years Correlation Summary

MeasurementParaguayanImmigrants from Mexico
Minimum1.3%2.7%
Maximum15.9%36.0%
Range14.6%33.3%
Mean4.5%7.7%
Median4.1%5.6%
Interquartile 25% (IQ1)3.4%5.0%
Interquartile 75% (IQ3)5.0%7.3%
Interquartile Range (IQR)1.6%2.3%
Standard Deviation (Sample)2.5%5.8%
Standard Deviation (Population)2.4%5.7%

Similar Demographics by Unemployment Among Ages 35 to 44 years

Demographics Similar to Paraguayans by Unemployment Among Ages 35 to 44 years

In terms of unemployment among ages 35 to 44 years, the demographic groups most similar to Paraguayans are Scandinavian (4.2%, a difference of 0.26%), Immigrants from Kuwait (4.3%, a difference of 0.41%), Tlingit-Haida (4.3%, a difference of 0.42%), Immigrants from Bolivia (4.2%, a difference of 0.75%), and Bulgarian (4.3%, a difference of 0.89%).
DemographicsRating | RankUnemployment Among Ages 35 to 44 years
Czechs
99.9
/100
|
#14
Exceptional
4.1%
Tongans
99.8
/100
|
#15
Exceptional
4.2%
Cubans
99.8
/100
|
#16
Exceptional
4.2%
Swedes
99.8
/100
|
#17
Exceptional
4.2%
Latvians
99.8
/100
|
#18
Exceptional
4.2%
Immigrants | Nepal
99.7
/100
|
#19
Exceptional
4.2%
Immigrants | Bolivia
99.7
/100
|
#20
Exceptional
4.2%
Paraguayans
99.6
/100
|
#21
Exceptional
4.2%
Scandinavians
99.5
/100
|
#22
Exceptional
4.2%
Immigrants | Kuwait
99.5
/100
|
#23
Exceptional
4.3%
Tlingit-Haida
99.5
/100
|
#24
Exceptional
4.3%
Bulgarians
99.3
/100
|
#25
Exceptional
4.3%
Turks
99.3
/100
|
#26
Exceptional
4.3%
Assyrians/Chaldeans/Syriacs
99.3
/100
|
#27
Exceptional
4.3%
Immigrants | Japan
99.3
/100
|
#28
Exceptional
4.3%

Demographics Similar to Immigrants from Mexico by Unemployment Among Ages 35 to 44 years

In terms of unemployment among ages 35 to 44 years, the demographic groups most similar to Immigrants from Mexico are Native Hawaiian (5.4%, a difference of 0.010%), Creek (5.4%, a difference of 0.080%), Immigrants from Caribbean (5.4%, a difference of 0.090%), Vietnamese (5.4%, a difference of 0.12%), and Senegalese (5.3%, a difference of 0.30%).
DemographicsRating | RankUnemployment Among Ages 35 to 44 years
Hawaiians
0.0
/100
|
#268
Tragic
5.3%
Cajuns
0.0
/100
|
#269
Tragic
5.3%
Blackfeet
0.0
/100
|
#270
Tragic
5.3%
Ute
0.0
/100
|
#271
Tragic
5.3%
Senegalese
0.0
/100
|
#272
Tragic
5.3%
Vietnamese
0.0
/100
|
#273
Tragic
5.4%
Creek
0.0
/100
|
#274
Tragic
5.4%
Immigrants | Mexico
0.0
/100
|
#275
Tragic
5.4%
Native Hawaiians
0.0
/100
|
#276
Tragic
5.4%
Immigrants | Caribbean
0.0
/100
|
#277
Tragic
5.4%
Lumbee
0.0
/100
|
#278
Tragic
5.4%
Immigrants | Senegal
0.0
/100
|
#279
Tragic
5.4%
Ecuadorians
0.0
/100
|
#280
Tragic
5.4%
Immigrants | Portugal
0.0
/100
|
#281
Tragic
5.4%
Immigrants | Ghana
0.0
/100
|
#282
Tragic
5.4%