Paraguayan vs Immigrants from Dominican Republic Unemployment Among Youth under 25 years
COMPARE
Paraguayan
Immigrants from Dominican Republic
Unemployment Among Youth under 25 years
Unemployment Among Youth under 25 years Comparison
Paraguayans
Immigrants from Dominican Republic
11.7%
UNEMPLOYMENT AMONG YOUTH UNDER 25 YEARS
27.2/ 100
METRIC RATING
195th/ 347
METRIC RANK
15.6%
UNEMPLOYMENT AMONG YOUTH UNDER 25 YEARS
0.0/ 100
METRIC RATING
328th/ 347
METRIC RANK
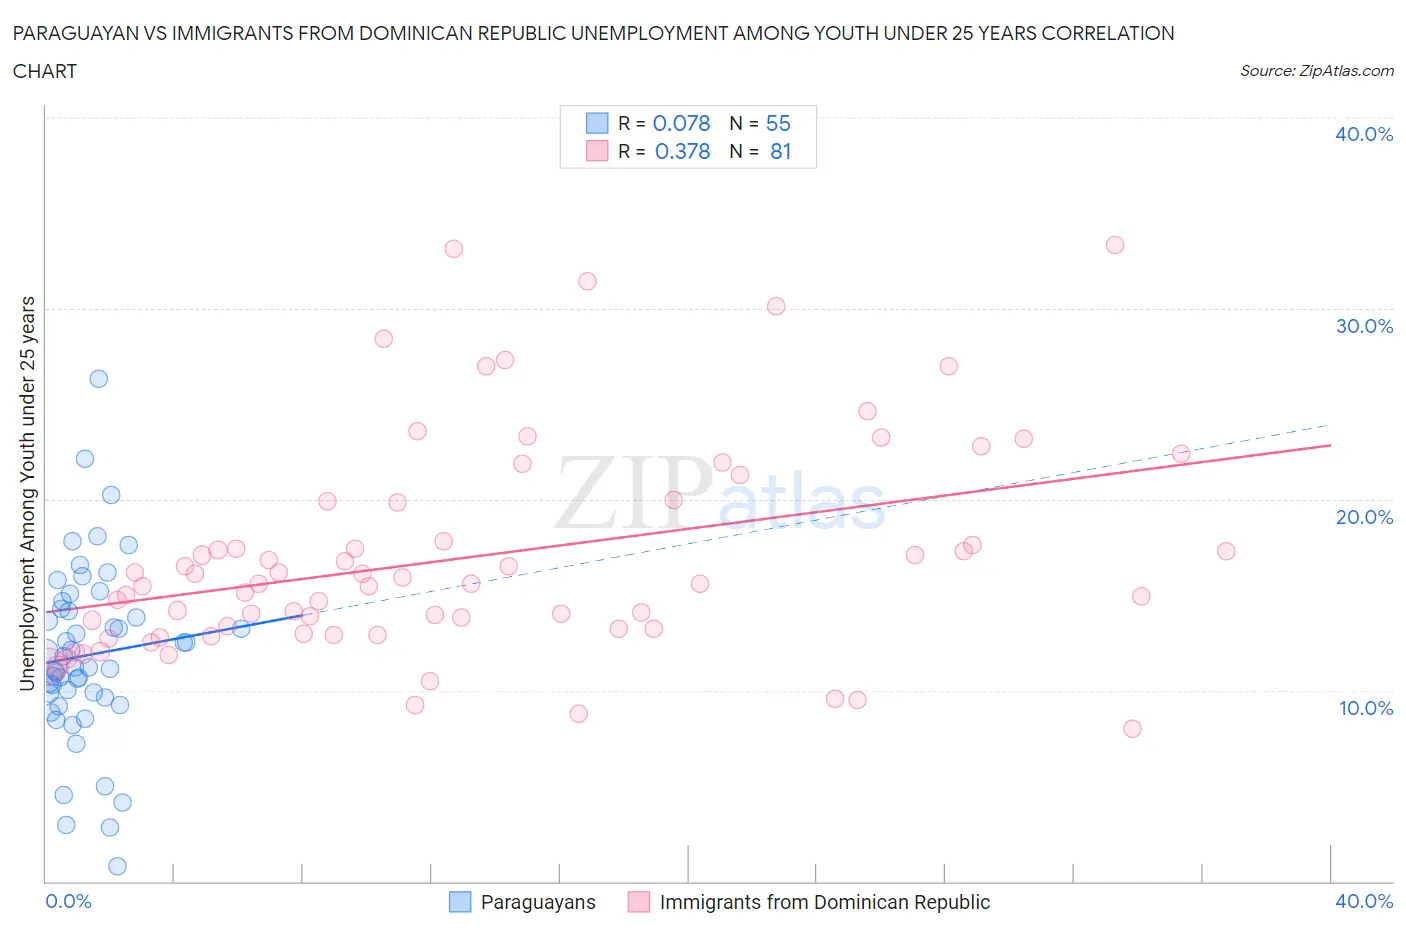
Paraguayan vs Immigrants from Dominican Republic Unemployment Among Youth under 25 years Correlation Chart
The statistical analysis conducted on geographies consisting of 94,860,622 people shows a slight positive correlation between the proportion of Paraguayans and unemployment rate among youth under the age of 25 in the United States with a correlation coefficient (R) of 0.078 and weighted average of 11.7%. Similarly, the statistical analysis conducted on geographies consisting of 272,581,719 people shows a mild positive correlation between the proportion of Immigrants from Dominican Republic and unemployment rate among youth under the age of 25 in the United States with a correlation coefficient (R) of 0.378 and weighted average of 15.6%, a difference of 32.8%.
Unemployment Among Youth under 25 years Correlation Summary
| Measurement | Paraguayan | Immigrants from Dominican Republic |
| Minimum | 0.80% | 8.0% |
| Maximum | 26.3% | 33.3% |
| Range | 25.5% | 25.3% |
| Mean | 11.8% | 17.0% |
| Median | 11.2% | 15.6% |
| Interquartile 25% (IQ1) | 9.6% | 13.1% |
| Interquartile 75% (IQ3) | 14.3% | 19.9% |
| Interquartile Range (IQR) | 4.7% | 6.8% |
| Standard Deviation (Sample) | 4.7% | 5.7% |
| Standard Deviation (Population) | 4.6% | 5.6% |
Similar Demographics by Unemployment Among Youth under 25 years
Demographics Similar to Paraguayans by Unemployment Among Youth under 25 years
In terms of unemployment among youth under 25 years, the demographic groups most similar to Paraguayans are Egyptian (11.7%, a difference of 0.010%), Immigrants from Sri Lanka (11.7%, a difference of 0.030%), Seminole (11.7%, a difference of 0.040%), Cypriot (11.7%, a difference of 0.070%), and Immigrants from Russia (11.7%, a difference of 0.070%).
| Demographics | Rating | Rank | Unemployment Among Youth under 25 years |
| Immigrants | Poland | 31.4 /100 | #188 | Fair 11.7% |
| Japanese | 30.8 /100 | #189 | Fair 11.7% |
| Portuguese | 30.3 /100 | #190 | Fair 11.7% |
| Cypriots | 28.5 /100 | #191 | Fair 11.7% |
| Immigrants | Russia | 28.5 /100 | #192 | Fair 11.7% |
| Seminole | 27.9 /100 | #193 | Fair 11.7% |
| Immigrants | Sri Lanka | 27.8 /100 | #194 | Fair 11.7% |
| Paraguayans | 27.2 /100 | #195 | Fair 11.7% |
| Egyptians | 26.9 /100 | #196 | Fair 11.7% |
| Koreans | 23.9 /100 | #197 | Fair 11.7% |
| Cherokee | 21.2 /100 | #198 | Fair 11.8% |
| Immigrants | Colombia | 20.9 /100 | #199 | Fair 11.8% |
| Arabs | 18.0 /100 | #200 | Poor 11.8% |
| Palestinians | 16.0 /100 | #201 | Poor 11.8% |
| Marshallese | 15.8 /100 | #202 | Poor 11.8% |
Demographics Similar to Immigrants from Dominican Republic by Unemployment Among Youth under 25 years
In terms of unemployment among youth under 25 years, the demographic groups most similar to Immigrants from Dominican Republic are British West Indian (15.5%, a difference of 0.11%), Immigrants from Yemen (15.6%, a difference of 0.13%), Yakama (15.6%, a difference of 0.17%), Dominican (15.7%, a difference of 1.0%), and Immigrants from Grenada (15.8%, a difference of 1.7%).
| Demographics | Rating | Rank | Unemployment Among Youth under 25 years |
| Cheyenne | 0.0 /100 | #321 | Tragic 14.6% |
| Trinidadians and Tobagonians | 0.0 /100 | #322 | Tragic 14.6% |
| Immigrants | Trinidad and Tobago | 0.0 /100 | #323 | Tragic 14.6% |
| Immigrants | Jamaica | 0.0 /100 | #324 | Tragic 14.8% |
| Alaska Natives | 0.0 /100 | #325 | Tragic 14.9% |
| Immigrants | Barbados | 0.0 /100 | #326 | Tragic 15.2% |
| British West Indians | 0.0 /100 | #327 | Tragic 15.5% |
| Immigrants | Dominican Republic | 0.0 /100 | #328 | Tragic 15.6% |
| Immigrants | Yemen | 0.0 /100 | #329 | Tragic 15.6% |
| Yakama | 0.0 /100 | #330 | Tragic 15.6% |
| Dominicans | 0.0 /100 | #331 | Tragic 15.7% |
| Immigrants | Grenada | 0.0 /100 | #332 | Tragic 15.8% |
| Guyanese | 0.0 /100 | #333 | Tragic 15.9% |
| Immigrants | Guyana | 0.0 /100 | #334 | Tragic 15.9% |
| Immigrants | St. Vincent and the Grenadines | 0.0 /100 | #335 | Tragic 16.1% |