Panamanian vs Mexican American Indian Unemployment Among Ages 16 to 19 years
COMPARE
Panamanian
Mexican American Indian
Unemployment Among Ages 16 to 19 years
Unemployment Among Ages 16 to 19 years Comparison
Panamanians
Mexican American Indians
18.7%
UNEMPLOYMENT AMONG AGES 16 TO 19 YEARS
0.4/ 100
METRIC RATING
250th/ 347
METRIC RANK
18.8%
UNEMPLOYMENT AMONG AGES 16 TO 19 YEARS
0.3/ 100
METRIC RATING
256th/ 347
METRIC RANK
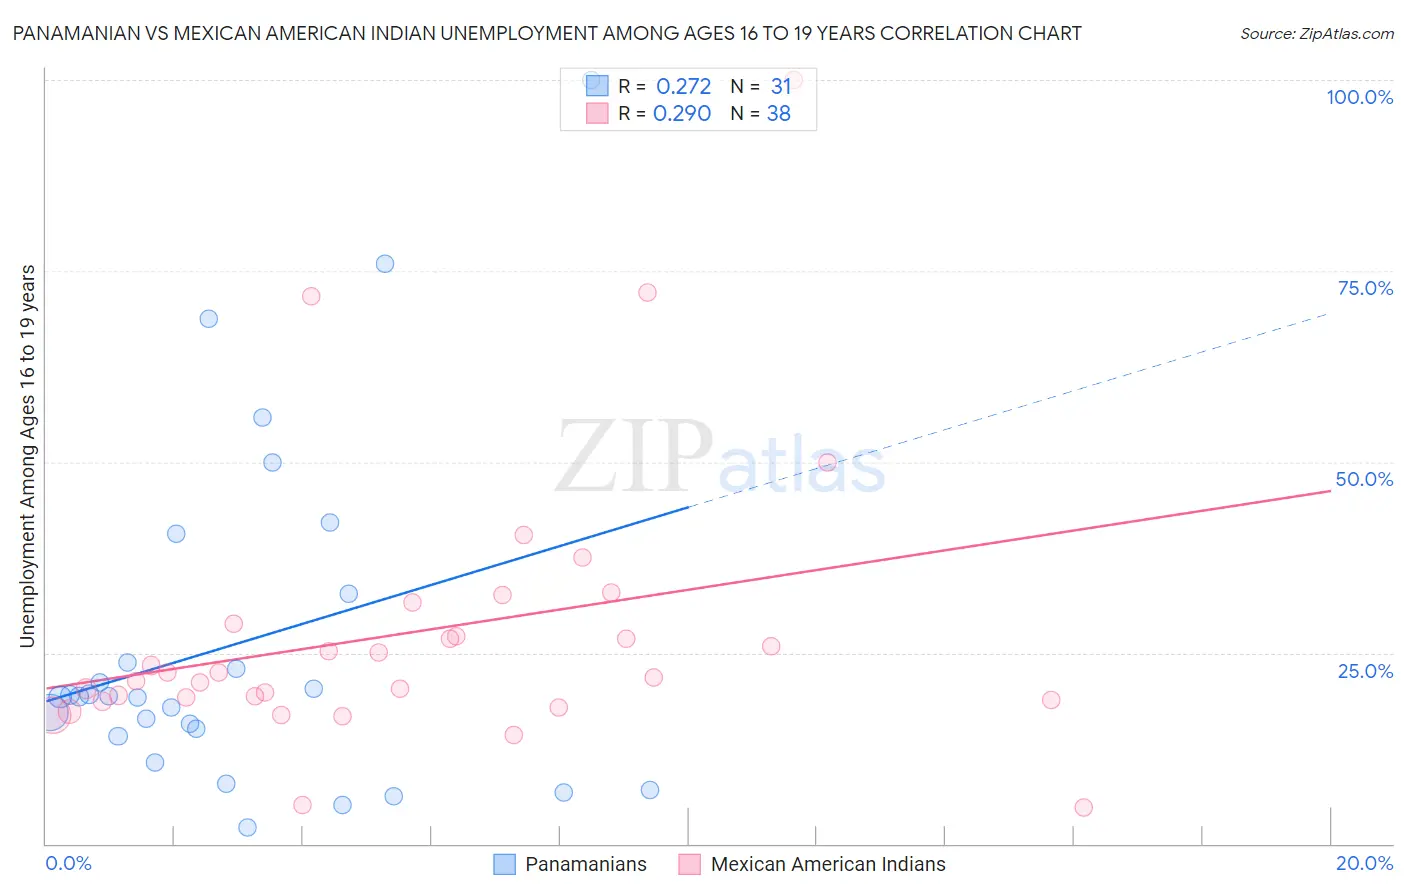
Panamanian vs Mexican American Indian Unemployment Among Ages 16 to 19 years Correlation Chart
The statistical analysis conducted on geographies consisting of 272,796,489 people shows a weak positive correlation between the proportion of Panamanians and unemployment rate among population between the ages 16 and 19 in the United States with a correlation coefficient (R) of 0.272 and weighted average of 18.7%. Similarly, the statistical analysis conducted on geographies consisting of 306,565,070 people shows a weak positive correlation between the proportion of Mexican American Indians and unemployment rate among population between the ages 16 and 19 in the United States with a correlation coefficient (R) of 0.290 and weighted average of 18.8%, a difference of 0.55%.
Unemployment Among Ages 16 to 19 years Correlation Summary
| Measurement | Panamanian | Mexican American Indian |
| Minimum | 2.2% | 4.8% |
| Maximum | 100.0% | 100.0% |
| Range | 97.8% | 95.2% |
| Mean | 26.2% | 27.7% |
| Median | 19.3% | 22.0% |
| Interquartile 25% (IQ1) | 14.1% | 18.8% |
| Interquartile 75% (IQ3) | 32.7% | 28.8% |
| Interquartile Range (IQR) | 18.6% | 10.0% |
| Standard Deviation (Sample) | 22.7% | 18.4% |
| Standard Deviation (Population) | 22.3% | 18.1% |
Demographics Similar to Panamanians and Mexican American Indians by Unemployment Among Ages 16 to 19 years
In terms of unemployment among ages 16 to 19 years, the demographic groups most similar to Panamanians are Puget Sound Salish (18.7%, a difference of 0.11%), Subsaharan African (18.7%, a difference of 0.11%), Immigrants from Guatemala (18.7%, a difference of 0.13%), Delaware (18.7%, a difference of 0.17%), and Immigrants from Israel (18.7%, a difference of 0.20%). Similarly, the demographic groups most similar to Mexican American Indians are Immigrants from Cameroon (18.8%, a difference of 0.070%), Apache (18.8%, a difference of 0.080%), Central American (18.8%, a difference of 0.11%), Immigrants from Nigeria (18.9%, a difference of 0.26%), and Immigrants from Mexico (18.9%, a difference of 0.40%).
| Demographics | Rating | Rank | Unemployment Among Ages 16 to 19 years |
| Mexicans | 0.9 /100 | #243 | Tragic 18.5% |
| Guatemalans | 0.8 /100 | #244 | Tragic 18.6% |
| Immigrants | Belarus | 0.8 /100 | #245 | Tragic 18.6% |
| Immigrants | South America | 0.5 /100 | #246 | Tragic 18.7% |
| Immigrants | Israel | 0.5 /100 | #247 | Tragic 18.7% |
| Delaware | 0.5 /100 | #248 | Tragic 18.7% |
| Puget Sound Salish | 0.5 /100 | #249 | Tragic 18.7% |
| Panamanians | 0.4 /100 | #250 | Tragic 18.7% |
| Sub-Saharan Africans | 0.4 /100 | #251 | Tragic 18.7% |
| Immigrants | Guatemala | 0.4 /100 | #252 | Tragic 18.7% |
| Central Americans | 0.3 /100 | #253 | Tragic 18.8% |
| Apache | 0.3 /100 | #254 | Tragic 18.8% |
| Immigrants | Cameroon | 0.3 /100 | #255 | Tragic 18.8% |
| Mexican American Indians | 0.3 /100 | #256 | Tragic 18.8% |
| Immigrants | Nigeria | 0.2 /100 | #257 | Tragic 18.9% |
| Immigrants | Mexico | 0.2 /100 | #258 | Tragic 18.9% |
| Immigrants | Central America | 0.2 /100 | #259 | Tragic 18.9% |
| Nigerians | 0.2 /100 | #260 | Tragic 18.9% |
| Spanish American Indians | 0.1 /100 | #261 | Tragic 18.9% |
| Salvadorans | 0.1 /100 | #262 | Tragic 18.9% |
| Cree | 0.1 /100 | #263 | Tragic 19.0% |