Panamanian vs Inupiat Unemployment Among Ages 65 to 74 years
COMPARE
Panamanian
Inupiat
Unemployment Among Ages 65 to 74 years
Unemployment Among Ages 65 to 74 years Comparison
Panamanians
Inupiat
5.4%
UNEMPLOYMENT AMONG AGES 65 TO 74 YEARS
51.8/ 100
METRIC RATING
171st/ 347
METRIC RANK
7.5%
UNEMPLOYMENT AMONG AGES 65 TO 74 YEARS
0.0/ 100
METRIC RATING
344th/ 347
METRIC RANK
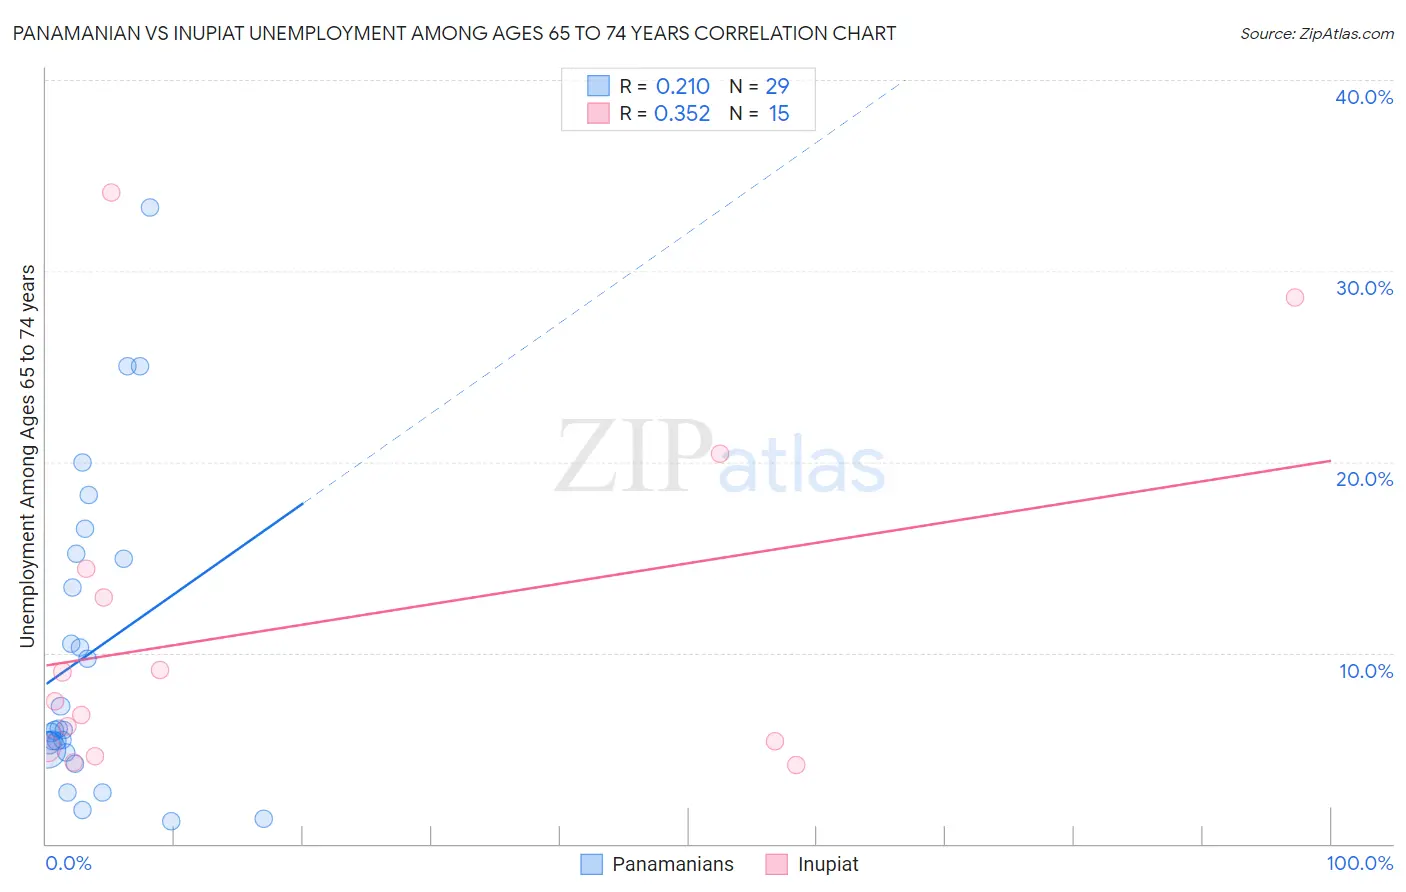
Panamanian vs Inupiat Unemployment Among Ages 65 to 74 years Correlation Chart
The statistical analysis conducted on geographies consisting of 256,936,594 people shows a weak positive correlation between the proportion of Panamanians and unemployment rate among population between the ages 65 and 74 in the United States with a correlation coefficient (R) of 0.210 and weighted average of 5.4%. Similarly, the statistical analysis conducted on geographies consisting of 91,705,326 people shows a mild positive correlation between the proportion of Inupiat and unemployment rate among population between the ages 65 and 74 in the United States with a correlation coefficient (R) of 0.352 and weighted average of 7.5%, a difference of 39.7%.
Unemployment Among Ages 65 to 74 years Correlation Summary
| Measurement | Panamanian | Inupiat |
| Minimum | 1.2% | 4.1% |
| Maximum | 33.3% | 34.1% |
| Range | 32.1% | 30.0% |
| Mean | 9.9% | 11.5% |
| Median | 5.9% | 7.5% |
| Interquartile 25% (IQ1) | 4.8% | 5.0% |
| Interquartile 75% (IQ3) | 15.1% | 14.4% |
| Interquartile Range (IQR) | 10.2% | 9.4% |
| Standard Deviation (Sample) | 8.1% | 9.3% |
| Standard Deviation (Population) | 8.0% | 9.0% |
Similar Demographics by Unemployment Among Ages 65 to 74 years
Demographics Similar to Panamanians by Unemployment Among Ages 65 to 74 years
In terms of unemployment among ages 65 to 74 years, the demographic groups most similar to Panamanians are Greek (5.4%, a difference of 0.020%), Immigrants from Northern Europe (5.4%, a difference of 0.020%), Potawatomi (5.4%, a difference of 0.060%), Syrian (5.4%, a difference of 0.070%), and Immigrants from Iran (5.4%, a difference of 0.090%).
| Demographics | Rating | Rank | Unemployment Among Ages 65 to 74 years |
| Immigrants | Philippines | 61.2 /100 | #164 | Good 5.3% |
| Immigrants | Bosnia and Herzegovina | 60.2 /100 | #165 | Good 5.3% |
| Slovaks | 60.0 /100 | #166 | Good 5.3% |
| Indians (Asian) | 59.9 /100 | #167 | Average 5.3% |
| Whites/Caucasians | 57.2 /100 | #168 | Average 5.4% |
| Laotians | 55.7 /100 | #169 | Average 5.4% |
| Syrians | 53.7 /100 | #170 | Average 5.4% |
| Panamanians | 51.8 /100 | #171 | Average 5.4% |
| Greeks | 51.1 /100 | #172 | Average 5.4% |
| Immigrants | Northern Europe | 51.1 /100 | #173 | Average 5.4% |
| Potawatomi | 50.0 /100 | #174 | Average 5.4% |
| Immigrants | Iran | 49.0 /100 | #175 | Average 5.4% |
| Immigrants | Western Europe | 47.3 /100 | #176 | Average 5.4% |
| Arabs | 46.8 /100 | #177 | Average 5.4% |
| French | 43.1 /100 | #178 | Average 5.4% |
Demographics Similar to Inupiat by Unemployment Among Ages 65 to 74 years
In terms of unemployment among ages 65 to 74 years, the demographic groups most similar to Inupiat are Alaskan Athabascan (7.4%, a difference of 1.9%), Navajo (6.9%, a difference of 8.2%), Alaska Native (6.8%, a difference of 9.8%), Immigrants from Yemen (8.3%, a difference of 10.2%), and Pima (6.6%, a difference of 13.3%).
| Demographics | Rating | Rank | Unemployment Among Ages 65 to 74 years |
| Paiute | 0.0 /100 | #333 | Tragic 6.3% |
| Taiwanese | 0.0 /100 | #334 | Tragic 6.3% |
| Puerto Ricans | 0.0 /100 | #335 | Tragic 6.4% |
| Immigrants | Armenia | 0.0 /100 | #336 | Tragic 6.5% |
| Ute | 0.0 /100 | #337 | Tragic 6.5% |
| Tlingit-Haida | 0.0 /100 | #338 | Tragic 6.5% |
| Yakama | 0.0 /100 | #339 | Tragic 6.6% |
| Pima | 0.0 /100 | #340 | Tragic 6.6% |
| Alaska Natives | 0.0 /100 | #341 | Tragic 6.8% |
| Navajo | 0.0 /100 | #342 | Tragic 6.9% |
| Alaskan Athabascans | 0.0 /100 | #343 | Tragic 7.4% |
| Inupiat | 0.0 /100 | #344 | Tragic 7.5% |
| Immigrants | Yemen | 0.0 /100 | #345 | Tragic 8.3% |
| Yup'ik | 0.0 /100 | #346 | Tragic 9.5% |
| Crow | 0.0 /100 | #347 | Tragic 17.4% |