Panamanian vs Aleut Unemployment Among Seniors over 65 years
COMPARE
Panamanian
Aleut
Unemployment Among Seniors over 65 years
Unemployment Among Seniors over 65 years Comparison
Panamanians
Aleuts
5.2%
UNEMPLOYMENT AMONG SENIORS OVER 65 YEARS
43.0/ 100
METRIC RATING
182nd/ 347
METRIC RANK
6.0%
UNEMPLOYMENT AMONG SENIORS OVER 65 YEARS
0.0/ 100
METRIC RATING
332nd/ 347
METRIC RANK
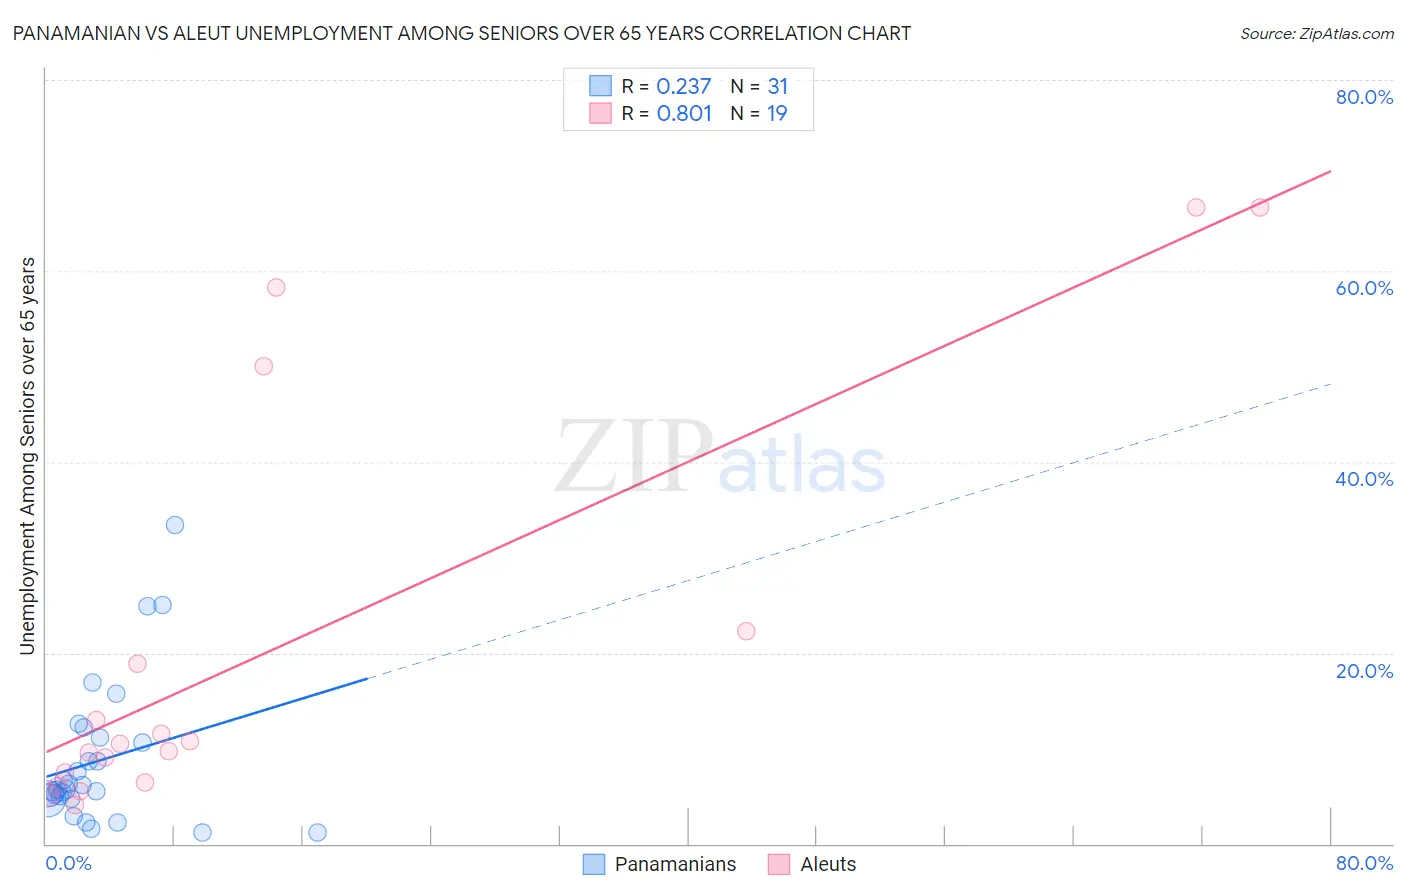
Panamanian vs Aleut Unemployment Among Seniors over 65 years Correlation Chart
The statistical analysis conducted on geographies consisting of 261,913,860 people shows a weak positive correlation between the proportion of Panamanians and unemployment rate amomg seniors over the age of 65 in the United States with a correlation coefficient (R) of 0.237 and weighted average of 5.2%. Similarly, the statistical analysis conducted on geographies consisting of 59,181,284 people shows a very strong positive correlation between the proportion of Aleuts and unemployment rate amomg seniors over the age of 65 in the United States with a correlation coefficient (R) of 0.801 and weighted average of 6.0%, a difference of 15.8%.
Unemployment Among Seniors over 65 years Correlation Summary
| Measurement | Panamanian | Aleut |
| Minimum | 1.2% | 4.1% |
| Maximum | 33.4% | 66.6% |
| Range | 32.2% | 62.5% |
| Mean | 8.7% | 20.6% |
| Median | 5.7% | 10.5% |
| Interquartile 25% (IQ1) | 4.8% | 6.4% |
| Interquartile 75% (IQ3) | 11.1% | 22.2% |
| Interquartile Range (IQR) | 6.4% | 15.8% |
| Standard Deviation (Sample) | 7.5% | 21.8% |
| Standard Deviation (Population) | 7.4% | 21.2% |
Similar Demographics by Unemployment Among Seniors over 65 years
Demographics Similar to Panamanians by Unemployment Among Seniors over 65 years
In terms of unemployment among seniors over 65 years, the demographic groups most similar to Panamanians are Immigrants from Italy (5.2%, a difference of 0.010%), Russian (5.2%, a difference of 0.020%), Immigrants from Somalia (5.2%, a difference of 0.030%), Immigrants from Western Asia (5.2%, a difference of 0.030%), and Immigrants from Serbia (5.2%, a difference of 0.050%).
| Demographics | Rating | Rank | Unemployment Among Seniors over 65 years |
| Immigrants | Eastern Europe | 49.8 /100 | #175 | Average 5.1% |
| Indians (Asian) | 46.6 /100 | #176 | Average 5.2% |
| Icelanders | 45.9 /100 | #177 | Average 5.2% |
| Immigrants | Belgium | 44.8 /100 | #178 | Average 5.2% |
| Immigrants | Somalia | 44.0 /100 | #179 | Average 5.2% |
| Russians | 43.6 /100 | #180 | Average 5.2% |
| Immigrants | Italy | 43.5 /100 | #181 | Average 5.2% |
| Panamanians | 43.0 /100 | #182 | Average 5.2% |
| Immigrants | Western Asia | 42.1 /100 | #183 | Average 5.2% |
| Immigrants | Serbia | 41.6 /100 | #184 | Average 5.2% |
| Immigrants | Iran | 36.0 /100 | #185 | Fair 5.2% |
| Americans | 35.1 /100 | #186 | Fair 5.2% |
| Somalis | 33.5 /100 | #187 | Fair 5.2% |
| Immigrants | Egypt | 33.2 /100 | #188 | Fair 5.2% |
| Bangladeshis | 32.3 /100 | #189 | Fair 5.2% |
Demographics Similar to Aleuts by Unemployment Among Seniors over 65 years
In terms of unemployment among seniors over 65 years, the demographic groups most similar to Aleuts are Taiwanese (6.0%, a difference of 0.050%), Immigrants from Portugal (6.0%, a difference of 0.20%), Dominican (6.0%, a difference of 0.22%), Immigrants from Dominican Republic (6.0%, a difference of 0.55%), and Puerto Rican (5.9%, a difference of 0.97%).
| Demographics | Rating | Rank | Unemployment Among Seniors over 65 years |
| Inupiat | 0.0 /100 | #325 | Tragic 5.8% |
| Shoshone | 0.0 /100 | #326 | Tragic 5.9% |
| Bermudans | 0.0 /100 | #327 | Tragic 5.9% |
| Puerto Ricans | 0.0 /100 | #328 | Tragic 5.9% |
| Dominicans | 0.0 /100 | #329 | Tragic 6.0% |
| Immigrants | Portugal | 0.0 /100 | #330 | Tragic 6.0% |
| Taiwanese | 0.0 /100 | #331 | Tragic 6.0% |
| Aleuts | 0.0 /100 | #332 | Tragic 6.0% |
| Immigrants | Dominican Republic | 0.0 /100 | #333 | Tragic 6.0% |
| Tohono O'odham | 0.0 /100 | #334 | Tragic 6.1% |
| Immigrants | Armenia | 0.0 /100 | #335 | Tragic 6.2% |
| Pima | 0.0 /100 | #336 | Tragic 6.3% |
| Alaska Natives | 0.0 /100 | #337 | Tragic 6.3% |
| Immigrants | Azores | 0.0 /100 | #338 | Tragic 6.3% |
| Paiute | 0.0 /100 | #339 | Tragic 6.3% |