Palestinian vs Sioux Unemployment Among Women with Children Under 18 years
COMPARE
Palestinian
Sioux
Unemployment Among Women with Children Under 18 years
Unemployment Among Women with Children Under 18 years Comparison
Palestinians
Sioux
5.2%
UNEMPLOYMENT AMONG WOMEN WITH CHILDREN UNDER 18 YEARS
92.2/ 100
METRIC RATING
97th/ 347
METRIC RANK
7.9%
UNEMPLOYMENT AMONG WOMEN WITH CHILDREN UNDER 18 YEARS
0.0/ 100
METRIC RATING
336th/ 347
METRIC RANK
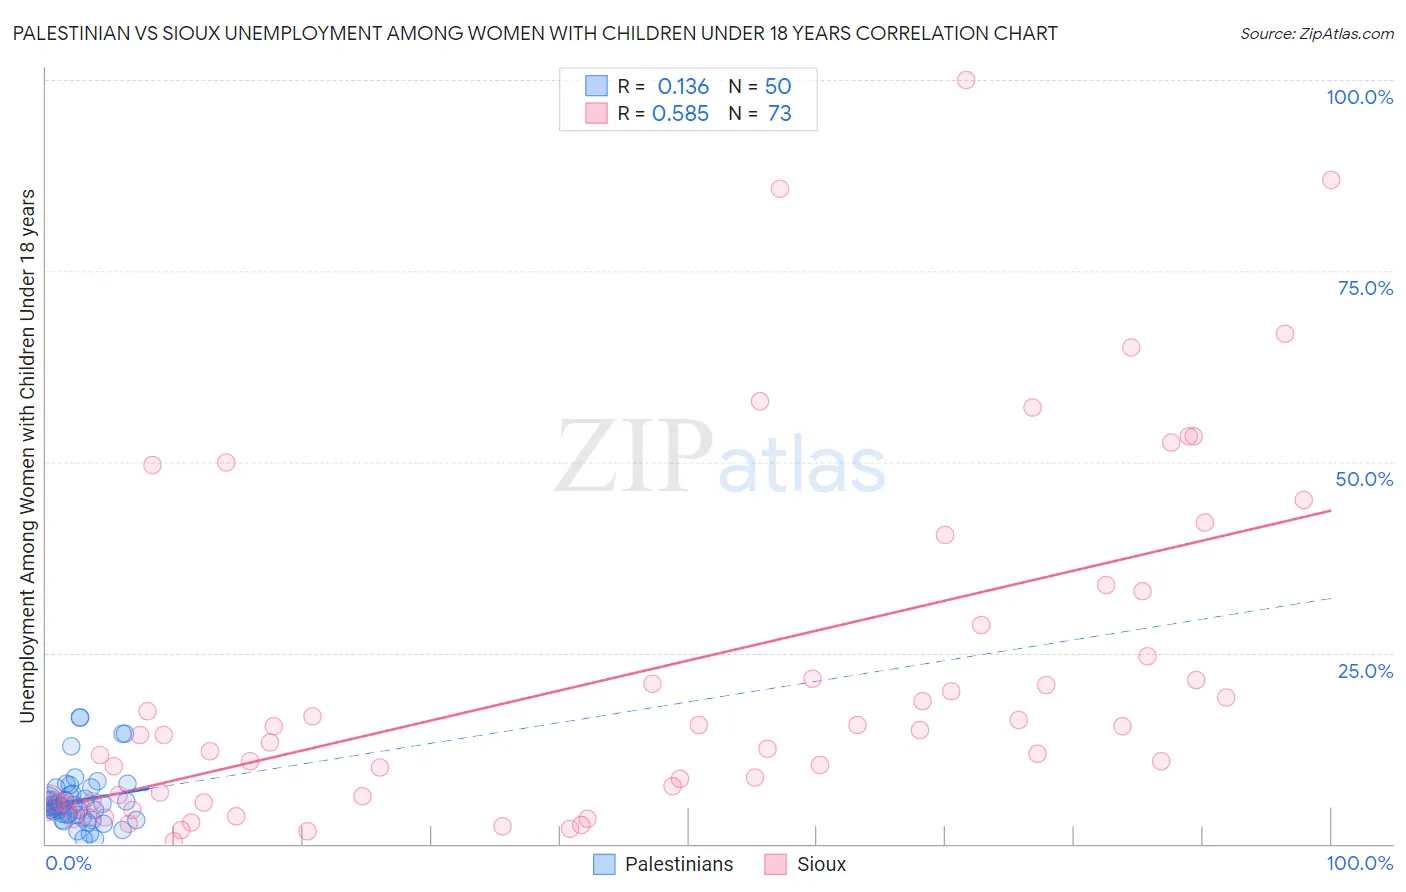
Palestinian vs Sioux Unemployment Among Women with Children Under 18 years Correlation Chart
The statistical analysis conducted on geographies consisting of 212,856,912 people shows a poor positive correlation between the proportion of Palestinians and unemployment rate among women with children under the age of 18 in the United States with a correlation coefficient (R) of 0.136 and weighted average of 5.2%. Similarly, the statistical analysis conducted on geographies consisting of 225,822,460 people shows a substantial positive correlation between the proportion of Sioux and unemployment rate among women with children under the age of 18 in the United States with a correlation coefficient (R) of 0.585 and weighted average of 7.9%, a difference of 52.5%.
Unemployment Among Women with Children Under 18 years Correlation Summary
| Measurement | Palestinian | Sioux |
| Minimum | 0.70% | 0.33% |
| Maximum | 16.5% | 100.0% |
| Range | 15.8% | 99.7% |
| Mean | 5.7% | 21.3% |
| Median | 4.9% | 13.2% |
| Interquartile 25% (IQ1) | 3.7% | 5.4% |
| Interquartile 75% (IQ3) | 6.6% | 26.6% |
| Interquartile Range (IQR) | 2.9% | 21.1% |
| Standard Deviation (Sample) | 3.6% | 22.6% |
| Standard Deviation (Population) | 3.6% | 22.5% |
Similar Demographics by Unemployment Among Women with Children Under 18 years
Demographics Similar to Palestinians by Unemployment Among Women with Children Under 18 years
In terms of unemployment among women with children under 18 years, the demographic groups most similar to Palestinians are Immigrants from Albania (5.2%, a difference of 0.0%), Immigrants from North America (5.2%, a difference of 0.020%), Immigrants from Vietnam (5.2%, a difference of 0.040%), Cuban (5.2%, a difference of 0.10%), and Immigrants from Kuwait (5.2%, a difference of 0.11%).
| Demographics | Rating | Rank | Unemployment Among Women with Children Under 18 years |
| Ukrainians | 93.8 /100 | #90 | Exceptional 5.2% |
| Immigrants | Zimbabwe | 93.6 /100 | #91 | Exceptional 5.2% |
| Immigrants | Pakistan | 93.3 /100 | #92 | Exceptional 5.2% |
| Immigrants | Canada | 93.3 /100 | #93 | Exceptional 5.2% |
| Immigrants | Kuwait | 92.6 /100 | #94 | Exceptional 5.2% |
| Immigrants | North America | 92.3 /100 | #95 | Exceptional 5.2% |
| Immigrants | Albania | 92.2 /100 | #96 | Exceptional 5.2% |
| Palestinians | 92.2 /100 | #97 | Exceptional 5.2% |
| Immigrants | Vietnam | 92.0 /100 | #98 | Exceptional 5.2% |
| Cubans | 91.8 /100 | #99 | Exceptional 5.2% |
| Immigrants | Greece | 91.4 /100 | #100 | Exceptional 5.2% |
| Immigrants | Netherlands | 91.0 /100 | #101 | Exceptional 5.2% |
| Immigrants | Cuba | 90.9 /100 | #102 | Exceptional 5.2% |
| Sri Lankans | 90.3 /100 | #103 | Exceptional 5.2% |
| Immigrants | Switzerland | 90.1 /100 | #104 | Exceptional 5.2% |
Demographics Similar to Sioux by Unemployment Among Women with Children Under 18 years
In terms of unemployment among women with children under 18 years, the demographic groups most similar to Sioux are Apache (7.9%, a difference of 0.30%), Cheyenne (7.8%, a difference of 1.3%), Yakama (8.1%, a difference of 1.4%), Immigrants from Yemen (8.2%, a difference of 3.1%), and Navajo (8.2%, a difference of 3.6%).
| Demographics | Rating | Rank | Unemployment Among Women with Children Under 18 years |
| Blacks/African Americans | 0.0 /100 | #329 | Tragic 7.3% |
| Colville | 0.0 /100 | #330 | Tragic 7.4% |
| Hopi | 0.0 /100 | #331 | Tragic 7.4% |
| Dominicans | 0.0 /100 | #332 | Tragic 7.5% |
| Immigrants | Dominican Republic | 0.0 /100 | #333 | Tragic 7.5% |
| Cheyenne | 0.0 /100 | #334 | Tragic 7.8% |
| Apache | 0.0 /100 | #335 | Tragic 7.9% |
| Sioux | 0.0 /100 | #336 | Tragic 7.9% |
| Yakama | 0.0 /100 | #337 | Tragic 8.1% |
| Immigrants | Yemen | 0.0 /100 | #338 | Tragic 8.2% |
| Navajo | 0.0 /100 | #339 | Tragic 8.2% |
| Crow | 0.0 /100 | #340 | Tragic 8.2% |
| Tohono O'odham | 0.0 /100 | #341 | Tragic 8.9% |
| Puerto Ricans | 0.0 /100 | #342 | Tragic 9.0% |
| Arapaho | 0.0 /100 | #343 | Tragic 9.2% |