Pakistani vs Ethiopian Unemployment Among Women with Children Under 18 years
COMPARE
Pakistani
Ethiopian
Unemployment Among Women with Children Under 18 years
Unemployment Among Women with Children Under 18 years Comparison
Pakistanis
Ethiopians
5.2%
UNEMPLOYMENT AMONG WOMEN WITH CHILDREN UNDER 18 YEARS
89.9/ 100
METRIC RATING
106th/ 347
METRIC RANK
5.3%
UNEMPLOYMENT AMONG WOMEN WITH CHILDREN UNDER 18 YEARS
80.7/ 100
METRIC RATING
133rd/ 347
METRIC RANK
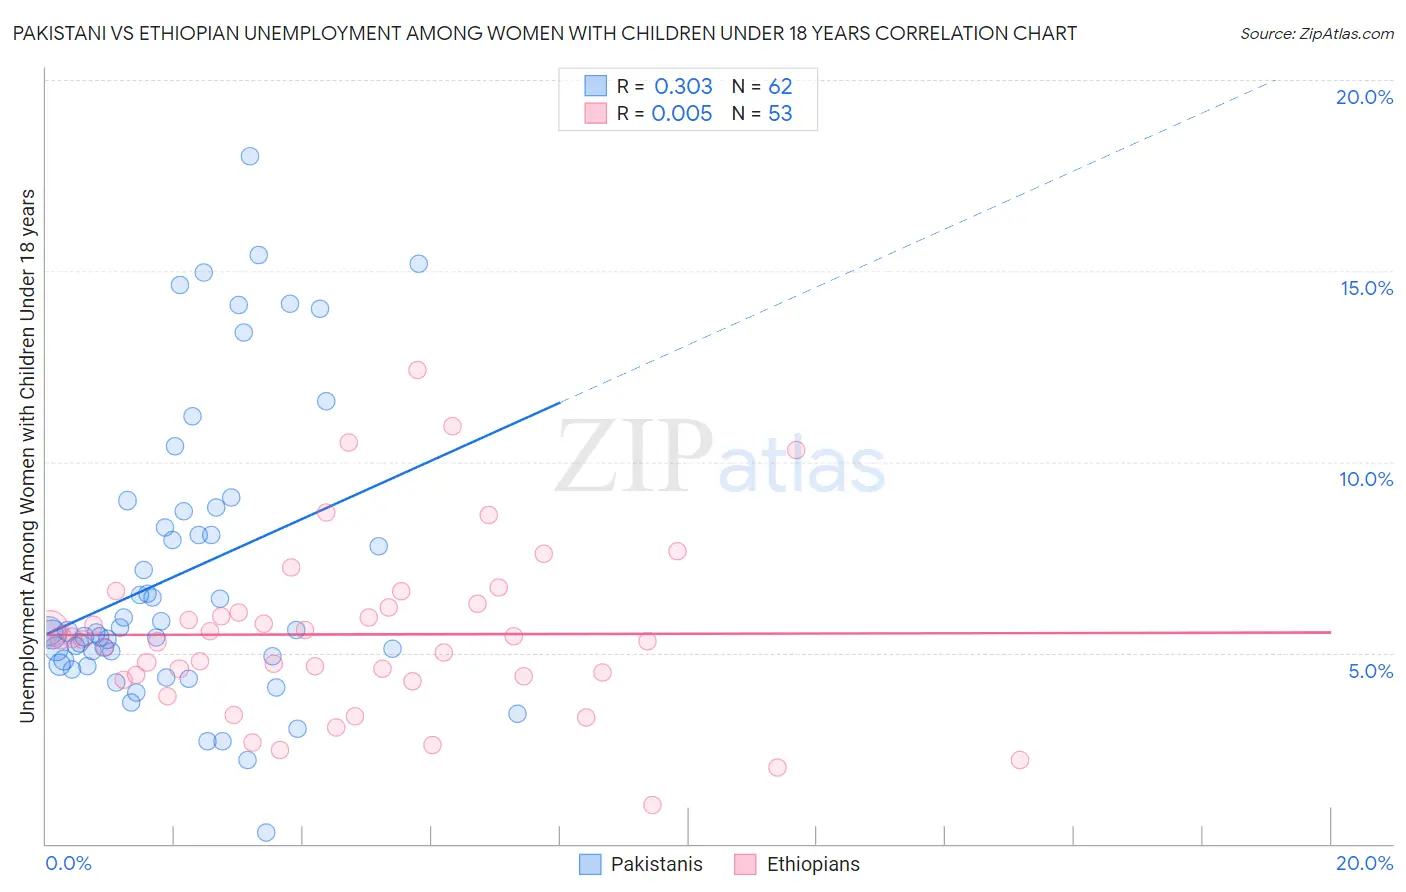
Pakistani vs Ethiopian Unemployment Among Women with Children Under 18 years Correlation Chart
The statistical analysis conducted on geographies consisting of 325,999,161 people shows a mild positive correlation between the proportion of Pakistanis and unemployment rate among women with children under the age of 18 in the United States with a correlation coefficient (R) of 0.303 and weighted average of 5.2%. Similarly, the statistical analysis conducted on geographies consisting of 219,206,869 people shows no correlation between the proportion of Ethiopians and unemployment rate among women with children under the age of 18 in the United States with a correlation coefficient (R) of 0.005 and weighted average of 5.3%, a difference of 1.4%.
Unemployment Among Women with Children Under 18 years Correlation Summary
| Measurement | Pakistani | Ethiopian |
| Minimum | 0.30% | 1.0% |
| Maximum | 18.0% | 12.4% |
| Range | 17.7% | 11.4% |
| Mean | 7.1% | 5.5% |
| Median | 5.6% | 5.4% |
| Interquartile 25% (IQ1) | 4.8% | 4.4% |
| Interquartile 75% (IQ3) | 8.7% | 6.2% |
| Interquartile Range (IQR) | 3.9% | 1.9% |
| Standard Deviation (Sample) | 3.8% | 2.3% |
| Standard Deviation (Population) | 3.8% | 2.2% |
Similar Demographics by Unemployment Among Women with Children Under 18 years
Demographics Similar to Pakistanis by Unemployment Among Women with Children Under 18 years
In terms of unemployment among women with children under 18 years, the demographic groups most similar to Pakistanis are Slavic (5.2%, a difference of 0.010%), Immigrants from France (5.2%, a difference of 0.020%), Immigrants from Switzerland (5.2%, a difference of 0.050%), Iranian (5.2%, a difference of 0.050%), and Sri Lankan (5.2%, a difference of 0.080%).
| Demographics | Rating | Rank | Unemployment Among Women with Children Under 18 years |
| Cubans | 91.8 /100 | #99 | Exceptional 5.2% |
| Immigrants | Greece | 91.4 /100 | #100 | Exceptional 5.2% |
| Immigrants | Netherlands | 91.0 /100 | #101 | Exceptional 5.2% |
| Immigrants | Cuba | 90.9 /100 | #102 | Exceptional 5.2% |
| Sri Lankans | 90.3 /100 | #103 | Exceptional 5.2% |
| Immigrants | Switzerland | 90.1 /100 | #104 | Exceptional 5.2% |
| Immigrants | France | 90.0 /100 | #105 | Excellent 5.2% |
| Pakistanis | 89.9 /100 | #106 | Excellent 5.2% |
| Slavs | 89.8 /100 | #107 | Excellent 5.2% |
| Iranians | 89.7 /100 | #108 | Excellent 5.2% |
| Immigrants | Russia | 89.0 /100 | #109 | Excellent 5.2% |
| Immigrants | Czechoslovakia | 88.9 /100 | #110 | Excellent 5.2% |
| French Canadians | 88.9 /100 | #111 | Excellent 5.2% |
| Immigrants | Eastern Europe | 88.5 /100 | #112 | Excellent 5.2% |
| French | 88.4 /100 | #113 | Excellent 5.2% |
Demographics Similar to Ethiopians by Unemployment Among Women with Children Under 18 years
In terms of unemployment among women with children under 18 years, the demographic groups most similar to Ethiopians are Slovak (5.3%, a difference of 0.020%), Immigrants from Ethiopia (5.3%, a difference of 0.080%), New Zealander (5.3%, a difference of 0.090%), Immigrants from Jordan (5.3%, a difference of 0.14%), and Immigrants from Israel (5.3%, a difference of 0.15%).
| Demographics | Rating | Rank | Unemployment Among Women with Children Under 18 years |
| Immigrants | Oceania | 83.1 /100 | #126 | Excellent 5.3% |
| Whites/Caucasians | 82.9 /100 | #127 | Excellent 5.3% |
| Immigrants | South Africa | 82.8 /100 | #128 | Excellent 5.3% |
| Immigrants | Italy | 82.3 /100 | #129 | Excellent 5.3% |
| Immigrants | Austria | 82.1 /100 | #130 | Excellent 5.3% |
| Immigrants | Israel | 81.9 /100 | #131 | Excellent 5.3% |
| Immigrants | Ethiopia | 81.4 /100 | #132 | Excellent 5.3% |
| Ethiopians | 80.7 /100 | #133 | Excellent 5.3% |
| Slovaks | 80.5 /100 | #134 | Excellent 5.3% |
| New Zealanders | 79.9 /100 | #135 | Good 5.3% |
| Immigrants | Jordan | 79.5 /100 | #136 | Good 5.3% |
| Jordanians | 78.8 /100 | #137 | Good 5.3% |
| Argentineans | 78.8 /100 | #138 | Good 5.3% |
| Immigrants | Ukraine | 78.5 /100 | #139 | Good 5.3% |
| Immigrants | Norway | 76.2 /100 | #140 | Good 5.3% |