Paiute vs Immigrants from Saudi Arabia Unemployment Among Ages 55 to 59 years
COMPARE
Paiute
Immigrants from Saudi Arabia
Unemployment Among Ages 55 to 59 years
Unemployment Among Ages 55 to 59 years Comparison
Paiute
Immigrants from Saudi Arabia
6.8%
UNEMPLOYMENT AMONG AGES 55 TO 59 YEARS
0.0/ 100
METRIC RATING
337th/ 347
METRIC RANK
4.5%
UNEMPLOYMENT AMONG AGES 55 TO 59 YEARS
99.7/ 100
METRIC RATING
49th/ 347
METRIC RANK
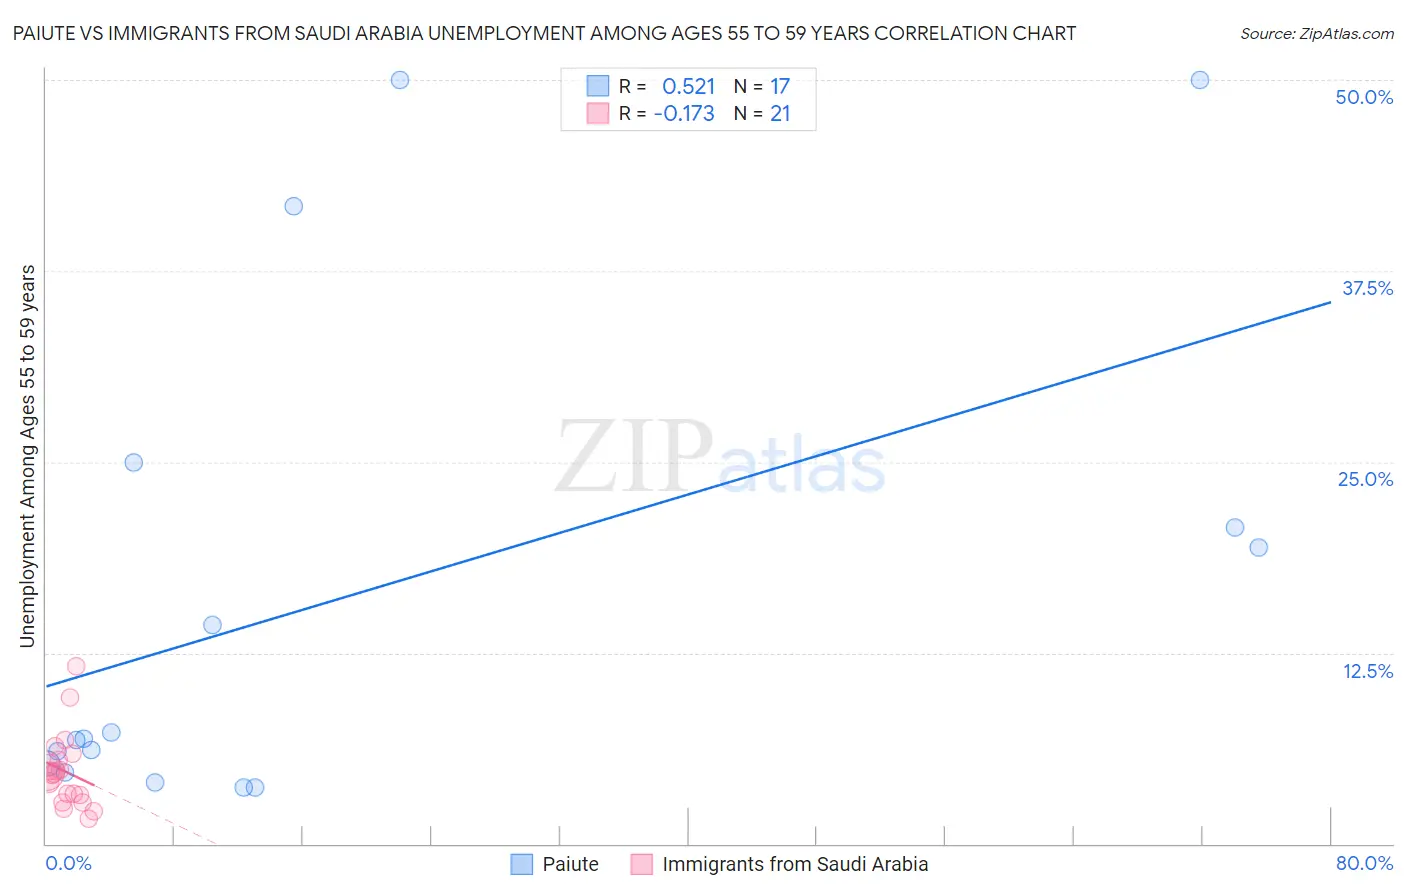
Paiute vs Immigrants from Saudi Arabia Unemployment Among Ages 55 to 59 years Correlation Chart
The statistical analysis conducted on geographies consisting of 57,126,693 people shows a substantial positive correlation between the proportion of Paiute and unemployment rate among population between the ages 55 and 59 in the United States with a correlation coefficient (R) of 0.521 and weighted average of 6.8%. Similarly, the statistical analysis conducted on geographies consisting of 160,151,566 people shows a poor negative correlation between the proportion of Immigrants from Saudi Arabia and unemployment rate among population between the ages 55 and 59 in the United States with a correlation coefficient (R) of -0.173 and weighted average of 4.5%, a difference of 49.1%.
Unemployment Among Ages 55 to 59 years Correlation Summary
| Measurement | Paiute | Immigrants from Saudi Arabia |
| Minimum | 3.7% | 1.6% |
| Maximum | 50.0% | 11.6% |
| Range | 46.3% | 10.0% |
| Mean | 16.2% | 4.7% |
| Median | 6.9% | 4.6% |
| Interquartile 25% (IQ1) | 5.0% | 2.9% |
| Interquartile 75% (IQ3) | 22.9% | 5.7% |
| Interquartile Range (IQR) | 17.9% | 2.7% |
| Standard Deviation (Sample) | 16.2% | 2.4% |
| Standard Deviation (Population) | 15.8% | 2.4% |
Similar Demographics by Unemployment Among Ages 55 to 59 years
Demographics Similar to Paiute by Unemployment Among Ages 55 to 59 years
In terms of unemployment among ages 55 to 59 years, the demographic groups most similar to Paiute are Navajo (6.7%, a difference of 0.52%), Colville (6.7%, a difference of 0.67%), Pueblo (6.7%, a difference of 0.85%), Immigrants from Yemen (6.9%, a difference of 1.9%), and Pima (6.6%, a difference of 2.1%).
| Demographics | Rating | Rank | Unemployment Among Ages 55 to 59 years |
| Alaska Natives | 0.0 /100 | #330 | Tragic 6.2% |
| Immigrants | Dominican Republic | 0.0 /100 | #331 | Tragic 6.3% |
| Aleuts | 0.0 /100 | #332 | Tragic 6.4% |
| Pima | 0.0 /100 | #333 | Tragic 6.6% |
| Pueblo | 0.0 /100 | #334 | Tragic 6.7% |
| Colville | 0.0 /100 | #335 | Tragic 6.7% |
| Navajo | 0.0 /100 | #336 | Tragic 6.7% |
| Paiute | 0.0 /100 | #337 | Tragic 6.8% |
| Immigrants | Yemen | 0.0 /100 | #338 | Tragic 6.9% |
| Puerto Ricans | 0.0 /100 | #339 | Tragic 7.0% |
| Alaskan Athabascans | 0.0 /100 | #340 | Tragic 7.1% |
| Shoshone | 0.0 /100 | #341 | Tragic 7.4% |
| Hopi | 0.0 /100 | #342 | Tragic 8.1% |
| Yakama | 0.0 /100 | #343 | Tragic 8.9% |
| Inupiat | 0.0 /100 | #344 | Tragic 9.0% |
Demographics Similar to Immigrants from Saudi Arabia by Unemployment Among Ages 55 to 59 years
In terms of unemployment among ages 55 to 59 years, the demographic groups most similar to Immigrants from Saudi Arabia are Immigrants from Moldova (4.5%, a difference of 0.020%), Immigrants from Pakistan (4.5%, a difference of 0.020%), Maltese (4.5%, a difference of 0.050%), Scottish (4.5%, a difference of 0.16%), and Immigrants from Middle Africa (4.5%, a difference of 0.17%).
| Demographics | Rating | Rank | Unemployment Among Ages 55 to 59 years |
| Immigrants | Kuwait | 99.8 /100 | #42 | Exceptional 4.5% |
| Immigrants | Korea | 99.8 /100 | #43 | Exceptional 4.5% |
| Europeans | 99.8 /100 | #44 | Exceptional 4.5% |
| British | 99.8 /100 | #45 | Exceptional 4.5% |
| Immigrants | Zaire | 99.8 /100 | #46 | Exceptional 4.5% |
| German Russians | 99.8 /100 | #47 | Exceptional 4.5% |
| Immigrants | Moldova | 99.7 /100 | #48 | Exceptional 4.5% |
| Immigrants | Saudi Arabia | 99.7 /100 | #49 | Exceptional 4.5% |
| Immigrants | Pakistan | 99.7 /100 | #50 | Exceptional 4.5% |
| Maltese | 99.7 /100 | #51 | Exceptional 4.5% |
| Scottish | 99.7 /100 | #52 | Exceptional 4.5% |
| Immigrants | Middle Africa | 99.7 /100 | #53 | Exceptional 4.5% |
| Burmese | 99.7 /100 | #54 | Exceptional 4.5% |
| Immigrants | Nepal | 99.6 /100 | #55 | Exceptional 4.5% |
| Welsh | 99.6 /100 | #56 | Exceptional 4.5% |