Paiute vs Immigrants from Ethiopia Unemployment Among Seniors over 75 years

COMPARE

Paiute
Race
Ancestry
AfghanAfricanAlaska NativeAlaskan AthabascanAlbanianAleutAlsatianAmericanApacheArabArapahoArgentineanArmenianAssyrian/Chaldean/SyriacAustralianAustrianBahamianBangladeshiBarbadianBasqueBelgianBelizeanBermudanBhutaneseBlackfeetBolivianBrazilianBritishBritish West IndianBulgarianBurmeseCajunCambodianCanadianCape VerdeanCarpatho RusynCelticCentral AmericanCentral American IndianCherokeeCheyenneChickasawChileanChineseChippewaChoctawColombianColvilleComancheCosta RicanCreeCreekCroatianCrowCubanCypriotCzechCzechoslovakianDanishDelawareDominicanDutchDutch West IndianEastern EuropeanEcuadorianEgyptianEnglishEstonianEthiopianEuropeanFijianFilipinoFinnishFrenchFrench American IndianFrench CanadianGermanGerman RussianGhanaianGreekGuamanian/ChamorroGuatemalanGuyaneseHaitianHmongHonduranHopiHoumaHungarianIcelanderIndian (Asian)IndonesianInupiatIranianIraqiIrishIroquoisIsraeliItalianJamaicanJapaneseJordanianKenyanKiowaKoreanLaotianLatvianLebaneseLiberianLithuanianLumbeeLuxembourgerMacedonianMalaysianMalteseMarshalleseMexicanMexican American IndianMongolianMoroccanNative HawaiianNavajoNepaleseNew ZealanderNicaraguanNigerianNorthern EuropeanNorwegianOkinawanOsageOttawaPaiutePakistaniPalestinianPanamanianParaguayanPennsylvania GermanPeruvianPimaPolishPortuguesePotawatomiPuebloPuerto RicanPuget Sound SalishRomanianRussianSalvadoranSamoanScandinavianScotch-IrishScottishSeminoleSenegaleseSerbianShoshoneSierra LeoneanSiouxSlavicSlovakSloveneSomaliSouth AfricanSouth AmericanSouth American IndianSoviet UnionSpaniardSpanishSpanish AmericanSpanish American IndianSri LankanSubsaharan AfricanSudaneseSwedishSwissSyrianTaiwaneseThaiTlingit-HaidaTohono O'OdhamTonganTrinidadian and TobagonianTsimshianTurkishU.S. Virgin IslanderUgandanUkrainianUruguayanUteVenezuelanVietnameseWelshWest IndianYakamaYaquiYugoslavianYumanYup'ikZimbabwean
Immigration
NonimmigrantsImmigrantsAfghanistanAfricaAlbaniaArgentinaArmeniaAsiaAustraliaAustriaBahamasBangladeshBarbadosBelarusBelgiumBelizeBoliviaBosnia and HerzegovinaBrazilBulgariaBurma/MyanmarCabo VerdeCambodiaCameroonCanadaCaribbeanCentral AmericaChileChinaColombiaCongoCosta RicaCroatiaCubaCzechoslovakiaDenmarkDominicaDominican RepublicEastern AfricaEastern AsiaEastern EuropeEcuadorEgyptEl SalvadorEnglandEritreaEuropeFijiFranceGermanyGhanaGreeceGrenadaGuatemalaGuyanaHaitiHondurasHong KongHungaryIndiaIndonesiaIranIraqIrelandIsraelItalyJamaicaJapanJordanKazakhstanKenyaKoreaKuwaitLaosLatin AmericaLatviaLebanonLiberiaLithuaniaMalaysiaMexicoMicronesiaMiddle AfricaMoldovaMoroccoNepalNetherlandsNicaraguaNigeriaNorth AmericaNorth MacedoniaNorthern AfricaNorthern EuropeNorwayOceaniaPakistanPanamaPeruPhilippinesPolandPortugalRomaniaRussiaSaudi ArabiaScotlandSenegalSerbiaSierra LeoneSingaporeSomaliaSouth AfricaSouth AmericaSouth Central AsiaSouth Eastern AsiaSouthern EuropeSpainSri LankaSt. Vincent and the GrenadinesSudanSwedenSwitzerlandSyriaTaiwanThailandTrinidad and TobagoTurkeyUgandaUkraineUruguayUzbekistanVenezuelaVietnamWest IndiesWestern AfricaWestern AsiaWestern EuropeYemenZaireZimbabweAzores
Immigrants from Ethiopia
Race
Ancestry
AfghanAfricanAlaska NativeAlaskan AthabascanAlbanianAleutAlsatianAmericanApacheArabArapahoArgentineanArmenianAssyrian/Chaldean/SyriacAustralianAustrianBahamianBangladeshiBarbadianBasqueBelgianBelizeanBermudanBhutaneseBlackfeetBolivianBrazilianBritishBritish West IndianBulgarianBurmeseCajunCambodianCanadianCape VerdeanCarpatho RusynCelticCentral AmericanCentral American IndianCherokeeCheyenneChickasawChileanChineseChippewaChoctawColombianColvilleComancheCosta RicanCreeCreekCroatianCrowCubanCypriotCzechCzechoslovakianDanishDelawareDominicanDutchDutch West IndianEastern EuropeanEcuadorianEgyptianEnglishEstonianEthiopianEuropeanFijianFilipinoFinnishFrenchFrench American IndianFrench CanadianGermanGerman RussianGhanaianGreekGuamanian/ChamorroGuatemalanGuyaneseHaitianHmongHonduranHopiHoumaHungarianIcelanderIndian (Asian)IndonesianInupiatIranianIraqiIrishIroquoisIsraeliItalianJamaicanJapaneseJordanianKenyanKiowaKoreanLaotianLatvianLebaneseLiberianLithuanianLumbeeLuxembourgerMacedonianMalaysianMalteseMarshalleseMexicanMexican American IndianMongolianMoroccanNative HawaiianNavajoNepaleseNew ZealanderNicaraguanNigerianNorthern EuropeanNorwegianOkinawanOsageOttawaPakistaniPalestinianPanamanianParaguayanPennsylvania GermanPeruvianPimaPolishPortuguesePotawatomiPuebloPuerto RicanPuget Sound SalishRomanianRussianSalvadoranSamoanScandinavianScotch-IrishScottishSeminoleSenegaleseSerbianShoshoneSierra LeoneanSiouxSlavicSlovakSloveneSomaliSouth AfricanSouth AmericanSouth American IndianSoviet UnionSpaniardSpanishSpanish AmericanSpanish American IndianSri LankanSubsaharan AfricanSudaneseSwedishSwissSyrianTaiwaneseThaiTlingit-HaidaTohono O'OdhamTonganTrinidadian and TobagonianTsimshianTurkishU.S. Virgin IslanderUgandanUkrainianUruguayanUteVenezuelanVietnameseWelshWest IndianYakamaYaquiYugoslavianYumanYup'ikZimbabwean
Immigration
NonimmigrantsImmigrantsAfghanistanAfricaAlbaniaArgentinaArmeniaAsiaAustraliaAustriaBahamasBangladeshBarbadosBelarusBelgiumBelizeBoliviaBosnia and HerzegovinaBrazilBulgariaBurma/MyanmarCabo VerdeCambodiaCameroonCanadaCaribbeanCentral AmericaChileChinaColombiaCongoCosta RicaCroatiaCubaCzechoslovakiaDenmarkDominicaDominican RepublicEastern AfricaEastern AsiaEastern EuropeEcuadorEgyptEl SalvadorEnglandEritreaEthiopiaEuropeFijiFranceGermanyGhanaGreeceGrenadaGuatemalaGuyanaHaitiHondurasHong KongHungaryIndiaIndonesiaIranIraqIrelandIsraelItalyJamaicaJapanJordanKazakhstanKenyaKoreaKuwaitLaosLatin AmericaLatviaLebanonLiberiaLithuaniaMalaysiaMexicoMicronesiaMiddle AfricaMoldovaMoroccoNepalNetherlandsNicaraguaNigeriaNorth AmericaNorth MacedoniaNorthern AfricaNorthern EuropeNorwayOceaniaPakistanPanamaPeruPhilippinesPolandPortugalRomaniaRussiaSaudi ArabiaScotlandSenegalSerbiaSierra LeoneSingaporeSomaliaSouth AfricaSouth AmericaSouth Central AsiaSouth Eastern AsiaSouthern EuropeSpainSri LankaSt. Vincent and the GrenadinesSudanSwedenSwitzerlandSyriaTaiwanThailandTrinidad and TobagoTurkeyUgandaUkraineUruguayUzbekistanVenezuelaVietnamWest IndiesWestern AfricaWestern AsiaWestern EuropeYemenZaireZimbabweAzores
Unemployment Among Seniors over 75 years
Income
Poverty
Unemployment
Labor Participation
Family Structure
Vehicle Availability
Education Level
Disability

Unemployment Among Seniors over 75 years Comparison

Paiute

Immigrants from Ethiopia

Excellent
Fair
8.6%
UNEMPLOYMENT AMONG SENIORS OVER 75 YEARS
82.5/ 100
METRIC RATING
150th/ 347
METRIC RANK
8.8%
UNEMPLOYMENT AMONG SENIORS OVER 75 YEARS
36.2/ 100
METRIC RATING
186th/ 347
METRIC RANK

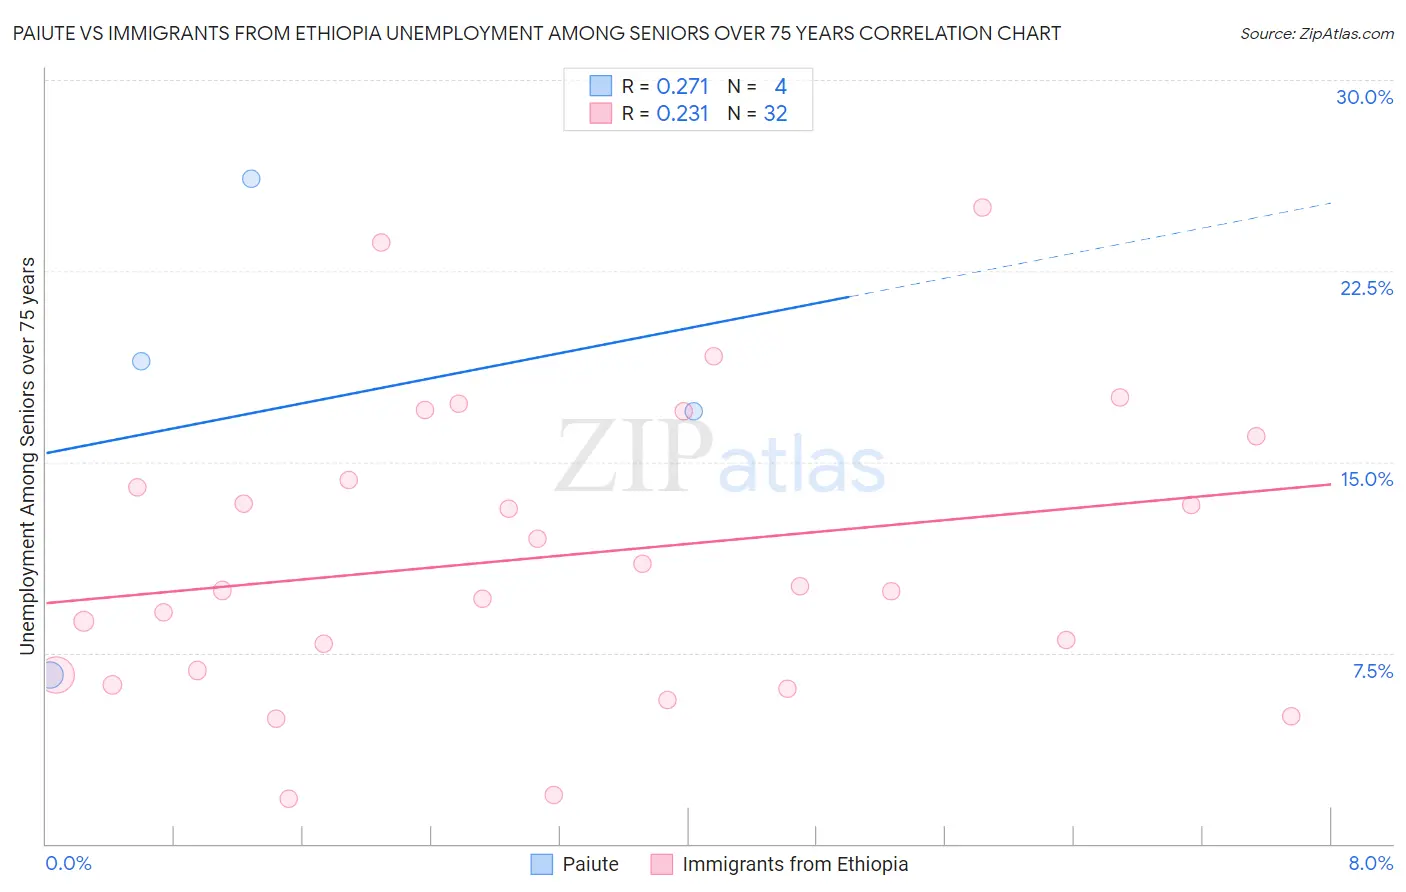
Paiute vs Immigrants from Ethiopia Unemployment Among Seniors over 75 years Correlation Chart

The statistical analysis conducted on geographies consisting of 47,269,504 people shows a weak positive correlation between the proportion of Paiute and unemployment rate among seniors over the age of 75 in the United States with a correlation coefficient (R) of 0.271 and weighted average of 8.6%. Similarly, the statistical analysis conducted on geographies consisting of 132,485,698 people shows a weak positive correlation between the proportion of Immigrants from Ethiopia and unemployment rate among seniors over the age of 75 in the United States with a correlation coefficient (R) of 0.231 and weighted average of 8.8%, a difference of 2.9%.
Paiute vs Immigrants from Ethiopia Unemployment Among Seniors over 75 years

Unemployment Among Seniors over 75 years Correlation Summary

MeasurementPaiuteImmigrants from Ethiopia
Minimum6.6%1.8%
Maximum26.1%25.0%
Range19.5%23.2%
Mean17.2%11.3%
Median18.0%10.0%
Interquartile 25% (IQ1)11.8%6.7%
Interquartile 75% (IQ3)22.5%15.2%
Interquartile Range (IQR)10.7%8.4%
Standard Deviation (Sample)8.1%5.7%
Standard Deviation (Population)7.0%5.6%

Similar Demographics by Unemployment Among Seniors over 75 years

Demographics Similar to Paiute by Unemployment Among Seniors over 75 years

In terms of unemployment among seniors over 75 years, the demographic groups most similar to Paiute are Immigrants from Bosnia and Herzegovina (8.6%, a difference of 0.17%), Latvian (8.6%, a difference of 0.18%), Immigrants from Ecuador (8.5%, a difference of 0.21%), Mongolian (8.6%, a difference of 0.21%), and Immigrants from Pakistan (8.6%, a difference of 0.25%).
DemographicsRating | RankUnemployment Among Seniors over 75 years
Immigrants | Costa Rica
86.8
/100
|
#143
Excellent
8.5%
Colombians
86.7
/100
|
#144
Excellent
8.5%
Immigrants | Romania
86.2
/100
|
#145
Excellent
8.5%
Immigrants | South Eastern Asia
85.8
/100
|
#146
Excellent
8.5%
Immigrants | Sierra Leone
85.6
/100
|
#147
Excellent
8.5%
Immigrants | Colombia
85.6
/100
|
#148
Excellent
8.5%
Immigrants | Ecuador
84.6
/100
|
#149
Excellent
8.5%
Paiute
82.5
/100
|
#150
Excellent
8.6%
Immigrants | Bosnia and Herzegovina
80.6
/100
|
#151
Excellent
8.6%
Latvians
80.5
/100
|
#152
Excellent
8.6%
Mongolians
80.1
/100
|
#153
Excellent
8.6%
Immigrants | Pakistan
79.7
/100
|
#154
Good
8.6%
Ecuadorians
78.5
/100
|
#155
Good
8.6%
Immigrants | Bahamas
76.5
/100
|
#156
Good
8.6%
Turks
76.4
/100
|
#157
Good
8.6%

Demographics Similar to Immigrants from Ethiopia by Unemployment Among Seniors over 75 years

In terms of unemployment among seniors over 75 years, the demographic groups most similar to Immigrants from Ethiopia are Choctaw (8.8%, a difference of 0.050%), Immigrants from Europe (8.8%, a difference of 0.050%), Immigrants from Micronesia (8.8%, a difference of 0.060%), Immigrants from Eastern Europe (8.8%, a difference of 0.080%), and Immigrants from Haiti (8.8%, a difference of 0.080%).
DemographicsRating | RankUnemployment Among Seniors over 75 years
Immigrants | Italy
41.7
/100
|
#179
Average
8.8%
Immigrants | Somalia
41.7
/100
|
#180
Average
8.8%
Immigrants | Thailand
40.2
/100
|
#181
Average
8.8%
Guatemalans
39.5
/100
|
#182
Fair
8.8%
Immigrants | Afghanistan
38.2
/100
|
#183
Fair
8.8%
Immigrants | Micronesia
37.2
/100
|
#184
Fair
8.8%
Choctaw
37.1
/100
|
#185
Fair
8.8%
Immigrants | Ethiopia
36.2
/100
|
#186
Fair
8.8%
Immigrants | Europe
35.2
/100
|
#187
Fair
8.8%
Immigrants | Eastern Europe
34.7
/100
|
#188
Fair
8.8%
Immigrants | Haiti
34.7
/100
|
#189
Fair
8.8%
Mexican American Indians
34.7
/100
|
#190
Fair
8.8%
Estonians
33.3
/100
|
#191
Fair
8.8%
Immigrants | Kenya
31.8
/100
|
#192
Fair
8.8%
Immigrants | Guyana
29.9
/100
|
#193
Fair
8.8%