Okinawan vs Hopi Unemployment Among Women with Children Under 6 years
COMPARE
Okinawan
Hopi
Unemployment Among Women with Children Under 6 years
Unemployment Among Women with Children Under 6 years Comparison
Okinawans
Hopi
5.8%
UNEMPLOYMENT AMONG WOMEN WITH CHILDREN UNDER 6 YEARS
100.0/ 100
METRIC RATING
3rd/ 347
METRIC RANK
16.8%
UNEMPLOYMENT AMONG WOMEN WITH CHILDREN UNDER 6 YEARS
0.0/ 100
METRIC RATING
344th/ 347
METRIC RANK
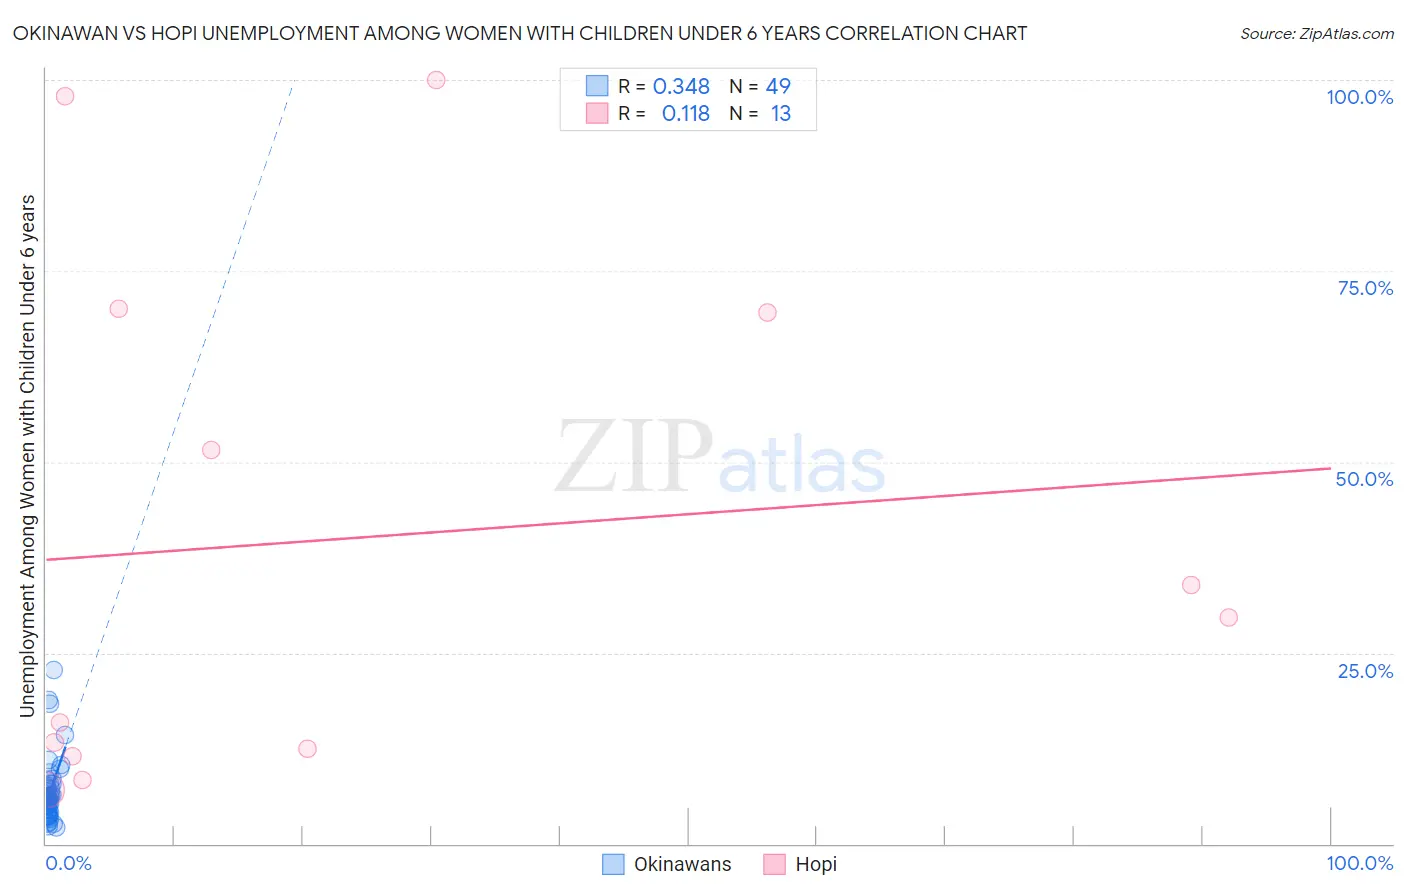
Okinawan vs Hopi Unemployment Among Women with Children Under 6 years Correlation Chart
The statistical analysis conducted on geographies consisting of 68,562,980 people shows a mild positive correlation between the proportion of Okinawans and unemployment rate among women with children under the age of 6 in the United States with a correlation coefficient (R) of 0.348 and weighted average of 5.8%. Similarly, the statistical analysis conducted on geographies consisting of 69,549,010 people shows a poor positive correlation between the proportion of Hopi and unemployment rate among women with children under the age of 6 in the United States with a correlation coefficient (R) of 0.118 and weighted average of 16.8%, a difference of 187.4%.
Unemployment Among Women with Children Under 6 years Correlation Summary
| Measurement | Okinawan | Hopi |
| Minimum | 2.1% | 7.0% |
| Maximum | 22.7% | 100.0% |
| Range | 20.6% | 93.0% |
| Mean | 6.7% | 40.1% |
| Median | 5.7% | 29.7% |
| Interquartile 25% (IQ1) | 4.0% | 12.0% |
| Interquartile 75% (IQ3) | 7.6% | 69.8% |
| Interquartile Range (IQR) | 3.6% | 57.8% |
| Standard Deviation (Sample) | 4.2% | 34.1% |
| Standard Deviation (Population) | 4.2% | 32.8% |
Similar Demographics by Unemployment Among Women with Children Under 6 years
Demographics Similar to Okinawans by Unemployment Among Women with Children Under 6 years
In terms of unemployment among women with children under 6 years, the demographic groups most similar to Okinawans are Immigrants from Hong Kong (5.8%, a difference of 0.87%), Cambodian (5.9%, a difference of 0.88%), Cape Verdean (5.9%, a difference of 1.9%), Immigrants from Taiwan (6.0%, a difference of 3.6%), and Taiwanese (6.1%, a difference of 4.2%).
| Demographics | Rating | Rank | Unemployment Among Women with Children Under 6 years |
| Immigrants | Cabo Verde | 100.0 /100 | #1 | Exceptional 5.4% |
| Immigrants | Hong Kong | 100.0 /100 | #2 | Exceptional 5.8% |
| Okinawans | 100.0 /100 | #3 | Exceptional 5.8% |
| Cambodians | 100.0 /100 | #4 | Exceptional 5.9% |
| Cape Verdeans | 100.0 /100 | #5 | Exceptional 5.9% |
| Immigrants | Taiwan | 100.0 /100 | #6 | Exceptional 6.0% |
| Taiwanese | 100.0 /100 | #7 | Exceptional 6.1% |
| Immigrants | India | 100.0 /100 | #8 | Exceptional 6.1% |
| Filipinos | 100.0 /100 | #9 | Exceptional 6.1% |
| Immigrants | China | 100.0 /100 | #10 | Exceptional 6.2% |
| Indians (Asian) | 100.0 /100 | #11 | Exceptional 6.3% |
| Immigrants | Singapore | 100.0 /100 | #12 | Exceptional 6.3% |
| Immigrants | Eastern Asia | 100.0 /100 | #13 | Exceptional 6.3% |
| Immigrants | Bulgaria | 100.0 /100 | #14 | Exceptional 6.3% |
| Thais | 100.0 /100 | #15 | Exceptional 6.3% |
Demographics Similar to Hopi by Unemployment Among Women with Children Under 6 years
In terms of unemployment among women with children under 6 years, the demographic groups most similar to Hopi are Inupiat (17.7%, a difference of 5.6%), Arapaho (19.0%, a difference of 13.5%), Crow (14.6%, a difference of 14.6%), Yuman (14.6%, a difference of 14.7%), and Lumbee (13.8%, a difference of 21.6%).
| Demographics | Rating | Rank | Unemployment Among Women with Children Under 6 years |
| Natives/Alaskans | 0.0 /100 | #333 | Tragic 11.5% |
| Apache | 0.0 /100 | #334 | Tragic 12.3% |
| Puerto Ricans | 0.0 /100 | #335 | Tragic 12.5% |
| Shoshone | 0.0 /100 | #336 | Tragic 13.2% |
| Chippewa | 0.0 /100 | #337 | Tragic 13.3% |
| Pima | 0.0 /100 | #338 | Tragic 13.4% |
| Navajo | 0.0 /100 | #339 | Tragic 13.5% |
| Immigrants | Yemen | 0.0 /100 | #340 | Tragic 13.5% |
| Lumbee | 0.0 /100 | #341 | Tragic 13.8% |
| Yuman | 0.0 /100 | #342 | Tragic 14.6% |
| Crow | 0.0 /100 | #343 | Tragic 14.6% |
| Hopi | 0.0 /100 | #344 | Tragic 16.8% |
| Inupiat | 0.0 /100 | #345 | Tragic 17.7% |
| Arapaho | 0.0 /100 | #346 | Tragic 19.0% |
| Yup'ik | 0.0 /100 | #347 | Tragic 21.1% |