Norwegian vs Malaysian Unemployment Among Women with Children Under 6 years
COMPARE
Norwegian
Malaysian
Unemployment Among Women with Children Under 6 years
Unemployment Among Women with Children Under 6 years Comparison
Norwegians
Malaysians
7.2%
UNEMPLOYMENT AMONG WOMEN WITH CHILDREN UNDER 6 YEARS
96.7/ 100
METRIC RATING
111th/ 347
METRIC RANK
7.7%
UNEMPLOYMENT AMONG WOMEN WITH CHILDREN UNDER 6 YEARS
31.1/ 100
METRIC RATING
195th/ 347
METRIC RANK
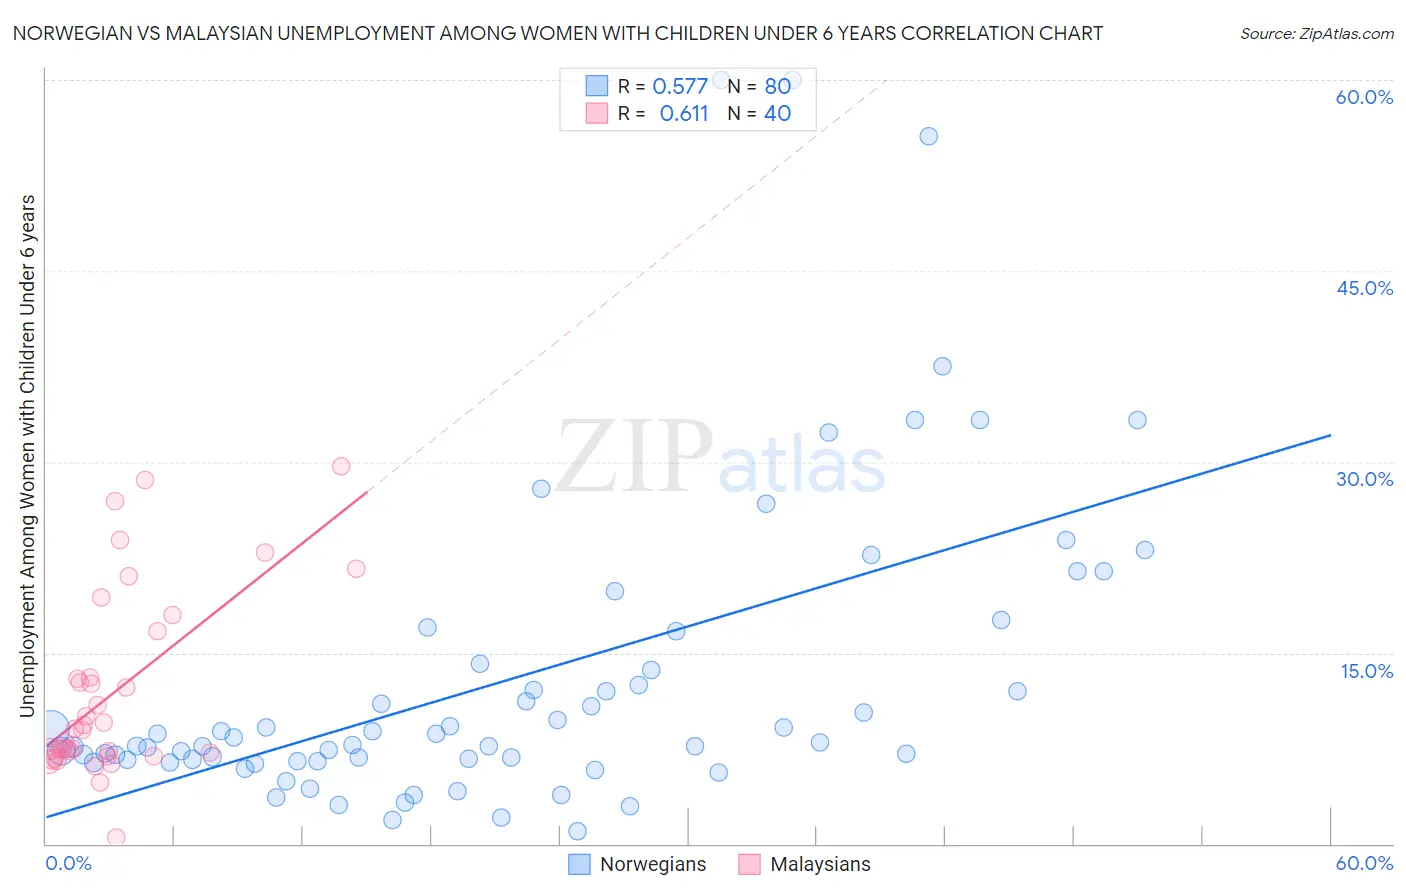
Norwegian vs Malaysian Unemployment Among Women with Children Under 6 years Correlation Chart
The statistical analysis conducted on geographies consisting of 360,664,498 people shows a substantial positive correlation between the proportion of Norwegians and unemployment rate among women with children under the age of 6 in the United States with a correlation coefficient (R) of 0.577 and weighted average of 7.2%. Similarly, the statistical analysis conducted on geographies consisting of 189,834,116 people shows a significant positive correlation between the proportion of Malaysians and unemployment rate among women with children under the age of 6 in the United States with a correlation coefficient (R) of 0.611 and weighted average of 7.7%, a difference of 7.3%.
Unemployment Among Women with Children Under 6 years Correlation Summary
| Measurement | Norwegian | Malaysian |
| Minimum | 1.0% | 0.50% |
| Maximum | 60.0% | 29.7% |
| Range | 59.0% | 29.2% |
| Mean | 12.9% | 11.9% |
| Median | 7.8% | 9.0% |
| Interquartile 25% (IQ1) | 6.5% | 7.0% |
| Interquartile 75% (IQ3) | 13.9% | 14.9% |
| Interquartile Range (IQR) | 7.3% | 7.8% |
| Standard Deviation (Sample) | 12.2% | 7.2% |
| Standard Deviation (Population) | 12.2% | 7.1% |
Similar Demographics by Unemployment Among Women with Children Under 6 years
Demographics Similar to Norwegians by Unemployment Among Women with Children Under 6 years
In terms of unemployment among women with children under 6 years, the demographic groups most similar to Norwegians are Palestinian (7.2%, a difference of 0.060%), Israeli (7.2%, a difference of 0.11%), Eastern European (7.2%, a difference of 0.13%), Australian (7.2%, a difference of 0.13%), and Nicaraguan (7.2%, a difference of 0.19%).
| Demographics | Rating | Rank | Unemployment Among Women with Children Under 6 years |
| Immigrants | Egypt | 97.2 /100 | #104 | Exceptional 7.2% |
| Venezuelans | 97.2 /100 | #105 | Exceptional 7.2% |
| Immigrants | Pakistan | 97.2 /100 | #106 | Exceptional 7.2% |
| Immigrants | Kazakhstan | 97.1 /100 | #107 | Exceptional 7.2% |
| Eastern Europeans | 96.9 /100 | #108 | Exceptional 7.2% |
| Australians | 96.9 /100 | #109 | Exceptional 7.2% |
| Palestinians | 96.8 /100 | #110 | Exceptional 7.2% |
| Norwegians | 96.7 /100 | #111 | Exceptional 7.2% |
| Israelis | 96.5 /100 | #112 | Exceptional 7.2% |
| Nicaraguans | 96.3 /100 | #113 | Exceptional 7.2% |
| Argentineans | 96.2 /100 | #114 | Exceptional 7.2% |
| Immigrants | Italy | 96.1 /100 | #115 | Exceptional 7.2% |
| Armenians | 95.9 /100 | #116 | Exceptional 7.2% |
| Immigrants | Kenya | 95.4 /100 | #117 | Exceptional 7.3% |
| Serbians | 94.5 /100 | #118 | Exceptional 7.3% |
Demographics Similar to Malaysians by Unemployment Among Women with Children Under 6 years
In terms of unemployment among women with children under 6 years, the demographic groups most similar to Malaysians are Immigrants from St. Vincent and the Grenadines (7.7%, a difference of 0.0%), Syrian (7.7%, a difference of 0.060%), Italian (7.7%, a difference of 0.060%), Lithuanian (7.8%, a difference of 0.090%), and Immigrants from Austria (7.7%, a difference of 0.10%).
| Demographics | Rating | Rank | Unemployment Among Women with Children Under 6 years |
| Czechoslovakians | 38.4 /100 | #188 | Fair 7.7% |
| Immigrants | Panama | 35.7 /100 | #189 | Fair 7.7% |
| Immigrants | North Macedonia | 34.4 /100 | #190 | Fair 7.7% |
| Immigrants | Austria | 32.4 /100 | #191 | Fair 7.7% |
| Immigrants | Africa | 32.4 /100 | #192 | Fair 7.7% |
| Slavs | 32.4 /100 | #193 | Fair 7.7% |
| Syrians | 31.9 /100 | #194 | Fair 7.7% |
| Malaysians | 31.1 /100 | #195 | Fair 7.7% |
| Immigrants | St. Vincent and the Grenadines | 31.1 /100 | #196 | Fair 7.7% |
| Italians | 30.4 /100 | #197 | Fair 7.7% |
| Lithuanians | 30.0 /100 | #198 | Fair 7.8% |
| Immigrants | Poland | 27.3 /100 | #199 | Fair 7.8% |
| Guamanians/Chamorros | 25.5 /100 | #200 | Fair 7.8% |
| Basques | 24.7 /100 | #201 | Fair 7.8% |
| Sudanese | 23.5 /100 | #202 | Fair 7.8% |