Nonimmigrants vs Iranian Unemployment Among Youth under 25 years

COMPARE

Nonimmigrants
Race
Ancestry
AfghanAfricanAlaska NativeAlaskan AthabascanAlbanianAleutAlsatianAmericanApacheArabArapahoArgentineanArmenianAssyrian/Chaldean/SyriacAustralianAustrianBahamianBangladeshiBarbadianBasqueBelgianBelizeanBermudanBhutaneseBlackfeetBolivianBrazilianBritishBritish West IndianBulgarianBurmeseCajunCambodianCanadianCape VerdeanCarpatho RusynCelticCentral AmericanCentral American IndianCherokeeCheyenneChickasawChileanChineseChippewaChoctawColombianColvilleComancheCosta RicanCreeCreekCroatianCrowCubanCypriotCzechCzechoslovakianDanishDelawareDominicanDutchDutch West IndianEastern EuropeanEcuadorianEgyptianEnglishEstonianEthiopianEuropeanFijianFilipinoFinnishFrenchFrench American IndianFrench CanadianGermanGerman RussianGhanaianGreekGuamanian/ChamorroGuatemalanGuyaneseHaitianHmongHonduranHopiHoumaHungarianIcelanderIndian (Asian)IndonesianInupiatIraqiIrishIroquoisIsraeliItalianJamaicanJapaneseJordanianKenyanKiowaKoreanLaotianLatvianLebaneseLiberianLithuanianLumbeeLuxembourgerMacedonianMalaysianMalteseMarshalleseMenomineeMexicanMexican American IndianMongolianMoroccanNative HawaiianNavajoNepaleseNew ZealanderNicaraguanNigerianNorthern EuropeanNorwegianOkinawanOsageOttawaPaiutePakistaniPalestinianPanamanianParaguayanPennsylvania GermanPeruvianPimaPolishPortuguesePotawatomiPuebloPuerto RicanPuget Sound SalishRomanianRussianSalvadoranSamoanScandinavianScotch-IrishScottishSeminoleSenegaleseSerbianShoshoneSierra LeoneanSiouxSlavicSlovakSloveneSomaliSouth AfricanSouth AmericanSouth American IndianSoviet UnionSpaniardSpanishSpanish AmericanSpanish American IndianSri LankanSubsaharan AfricanSudaneseSwedishSwissSyrianTaiwaneseThaiTlingit-HaidaTohono O'OdhamTonganTrinidadian and TobagonianTsimshianTurkishU.S. Virgin IslanderUgandanUkrainianUruguayanUteVenezuelanVietnameseWelshWest IndianYakamaYaquiYugoslavianYumanYup'ikZimbabwean
Immigration
NonimmigrantsImmigrantsAfghanistanAfricaAlbaniaArgentinaArmeniaAsiaAustraliaAustriaBahamasBangladeshBarbadosBelarusBelgiumBelizeBoliviaBosnia and HerzegovinaBrazilBulgariaBurma/MyanmarCabo VerdeCambodiaCameroonCanadaCaribbeanCentral AmericaChileChinaColombiaCongoCosta RicaCroatiaCubaCzechoslovakiaDenmarkDominicaDominican RepublicEastern AfricaEastern AsiaEastern EuropeEcuadorEgyptEl SalvadorEnglandEritreaEthiopiaEuropeFijiFranceGermanyGhanaGreeceGrenadaGuatemalaGuyanaHaitiHondurasHong KongHungaryIndiaIndonesiaIranIraqIrelandIsraelItalyJamaicaJapanJordanKazakhstanKenyaKoreaKuwaitLaosLatin AmericaLatviaLebanonLiberiaLithuaniaMalaysiaMexicoMicronesiaMiddle AfricaMoldovaMoroccoNepalNetherlandsNicaraguaNigeriaNorth AmericaNorth MacedoniaNorthern AfricaNorthern EuropeNorwayOceaniaPakistanPanamaPeruPhilippinesPolandPortugalRomaniaRussiaSaudi ArabiaScotlandSenegalSerbiaSierra LeoneSingaporeSomaliaSouth AfricaSouth AmericaSouth Central AsiaSouth Eastern AsiaSouthern EuropeSpainSri LankaSt. Vincent and the GrenadinesSudanSwedenSwitzerlandSyriaTaiwanThailandTrinidad and TobagoTurkeyUgandaUkraineUruguayUzbekistanVenezuelaVietnamWest IndiesWestern AfricaWestern AsiaWestern EuropeYemenZaireZimbabweAzores
Iranian
Race
Ancestry
AfghanAfricanAlaska NativeAlaskan AthabascanAlbanianAleutAlsatianAmericanApacheArabArapahoArgentineanArmenianAssyrian/Chaldean/SyriacAustralianAustrianBahamianBangladeshiBarbadianBasqueBelgianBelizeanBermudanBhutaneseBlackfeetBolivianBrazilianBritishBritish West IndianBulgarianBurmeseCajunCambodianCanadianCape VerdeanCarpatho RusynCelticCentral AmericanCentral American IndianCherokeeCheyenneChickasawChileanChineseChippewaChoctawColombianColvilleComancheCosta RicanCreeCreekCroatianCrowCubanCypriotCzechCzechoslovakianDanishDelawareDominicanDutchDutch West IndianEastern EuropeanEcuadorianEgyptianEnglishEstonianEthiopianEuropeanFijianFilipinoFinnishFrenchFrench American IndianFrench CanadianGermanGerman RussianGhanaianGreekGuamanian/ChamorroGuatemalanGuyaneseHaitianHmongHonduranHopiHoumaHungarianIcelanderIndian (Asian)IndonesianInupiatIranianIraqiIrishIroquoisIsraeliItalianJamaicanJapaneseJordanianKenyanKiowaKoreanLaotianLatvianLebaneseLiberianLithuanianLumbeeLuxembourgerMacedonianMalaysianMalteseMarshalleseMenomineeMexicanMexican American IndianMongolianMoroccanNative HawaiianNavajoNepaleseNew ZealanderNicaraguanNigerianNorthern EuropeanNorwegianOkinawanOsageOttawaPaiutePakistaniPalestinianPanamanianParaguayanPennsylvania GermanPeruvianPimaPolishPortuguesePotawatomiPuebloPuerto RicanPuget Sound SalishRomanianRussianSalvadoranSamoanScandinavianScotch-IrishScottishSeminoleSenegaleseSerbianShoshoneSierra LeoneanSiouxSlavicSlovakSloveneSomaliSouth AfricanSouth AmericanSouth American IndianSoviet UnionSpaniardSpanishSpanish AmericanSpanish American IndianSri LankanSubsaharan AfricanSudaneseSwedishSwissSyrianTaiwaneseThaiTlingit-HaidaTohono O'OdhamTonganTrinidadian and TobagonianTsimshianTurkishU.S. Virgin IslanderUgandanUkrainianUruguayanUteVenezuelanVietnameseWelshWest IndianYakamaYaquiYugoslavianYumanYup'ikZimbabwean
Immigration
ImmigrantsAfghanistanAfricaAlbaniaArgentinaArmeniaAsiaAustraliaAustriaBahamasBangladeshBarbadosBelarusBelgiumBelizeBoliviaBosnia and HerzegovinaBrazilBulgariaBurma/MyanmarCabo VerdeCambodiaCameroonCanadaCaribbeanCentral AmericaChileChinaColombiaCongoCosta RicaCroatiaCubaCzechoslovakiaDenmarkDominicaDominican RepublicEastern AfricaEastern AsiaEastern EuropeEcuadorEgyptEl SalvadorEnglandEritreaEthiopiaEuropeFijiFranceGermanyGhanaGreeceGrenadaGuatemalaGuyanaHaitiHondurasHong KongHungaryIndiaIndonesiaIranIraqIrelandIsraelItalyJamaicaJapanJordanKazakhstanKenyaKoreaKuwaitLaosLatin AmericaLatviaLebanonLiberiaLithuaniaMalaysiaMexicoMicronesiaMiddle AfricaMoldovaMoroccoNepalNetherlandsNicaraguaNigeriaNorth AmericaNorth MacedoniaNorthern AfricaNorthern EuropeNorwayOceaniaPakistanPanamaPeruPhilippinesPolandPortugalRomaniaRussiaSaudi ArabiaScotlandSenegalSerbiaSierra LeoneSingaporeSomaliaSouth AfricaSouth AmericaSouth Central AsiaSouth Eastern AsiaSouthern EuropeSpainSri LankaSt. Vincent and the GrenadinesSudanSwedenSwitzerlandSyriaTaiwanThailandTrinidad and TobagoTurkeyUgandaUkraineUruguayUzbekistanVenezuelaVietnamWest IndiesWestern AfricaWestern AsiaWestern EuropeYemenZaireZimbabweAzores
Unemployment Among Youth under 25 years
Income
Poverty
Unemployment
Labor Participation
Family Structure
Vehicle Availability
Education Level
Disability

Unemployment Among Youth under 25 years Comparison

Nonimmigrants

Iranians

Tragic
Exceptional
11.9%
UNEMPLOYMENT AMONG YOUTH UNDER 25 YEARS
6.2/ 100
METRIC RATING
219th/ 347
METRIC RANK
11.3%
UNEMPLOYMENT AMONG YOUTH UNDER 25 YEARS
92.0/ 100
METRIC RATING
109th/ 347
METRIC RANK

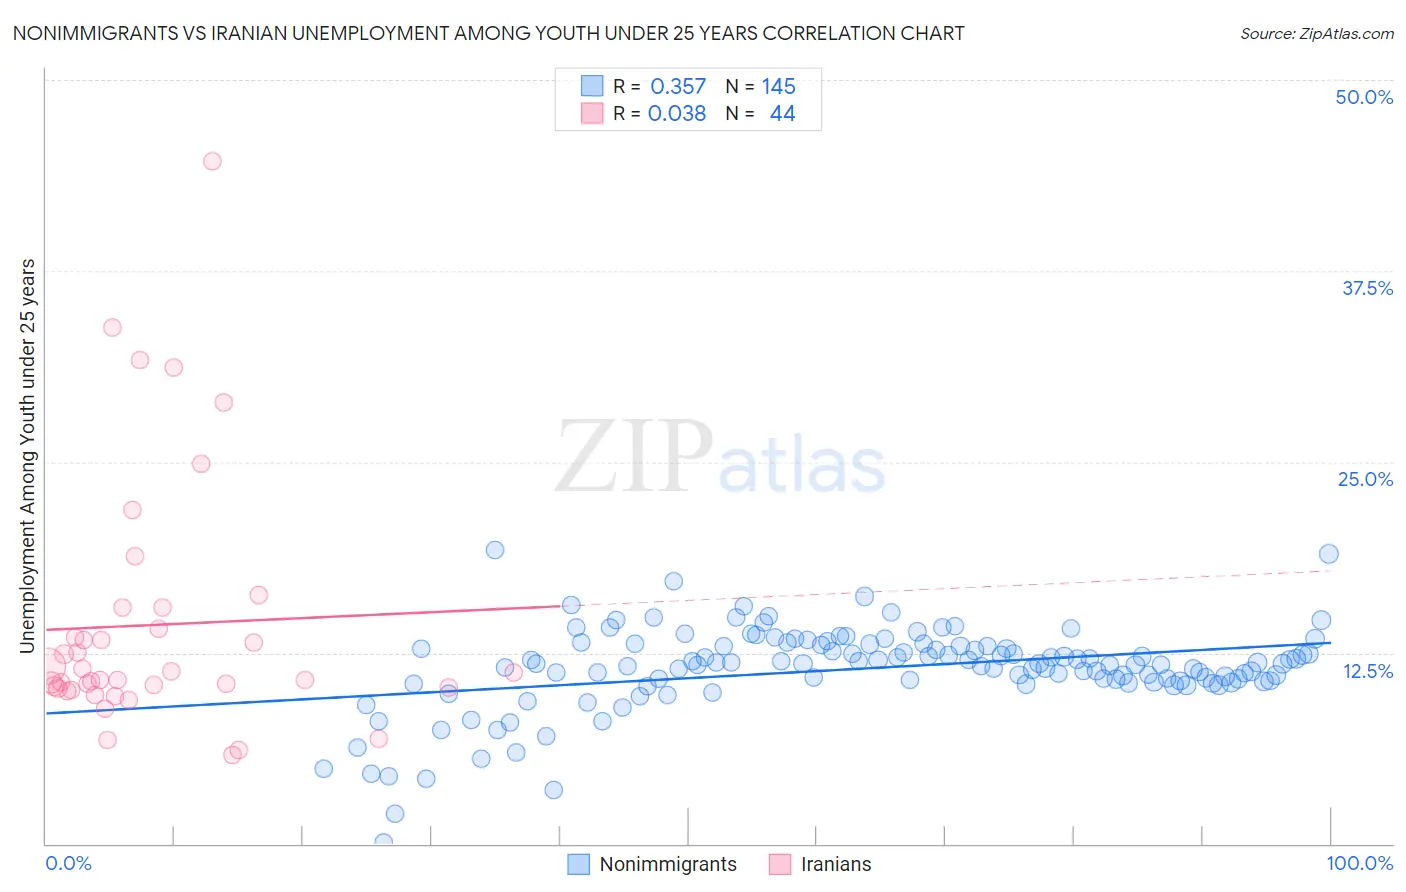
Nonimmigrants vs Iranian Unemployment Among Youth under 25 years Correlation Chart

The statistical analysis conducted on geographies consisting of 555,778,724 people shows a mild positive correlation between the proportion of Nonimmigrants and unemployment rate among youth under the age of 25 in the United States with a correlation coefficient (R) of 0.357 and weighted average of 11.9%. Similarly, the statistical analysis conducted on geographies consisting of 314,261,059 people shows no correlation between the proportion of Iranians and unemployment rate among youth under the age of 25 in the United States with a correlation coefficient (R) of 0.038 and weighted average of 11.3%, a difference of 5.4%.
Nonimmigrants vs Iranian Unemployment Among Youth under 25 years

Unemployment Among Youth under 25 years Correlation Summary

MeasurementNonimmigrantsIranian
Minimum0.10%5.8%
Maximum19.2%44.7%
Range19.1%38.9%
Mean11.5%14.3%
Median11.8%11.0%
Interquartile 25% (IQ1)10.7%10.2%
Interquartile 75% (IQ3)13.0%14.8%
Interquartile Range (IQR)2.3%4.6%
Standard Deviation (Sample)2.8%8.2%
Standard Deviation (Population)2.8%8.1%

Similar Demographics by Unemployment Among Youth under 25 years

Demographics Similar to Nonimmigrants by Unemployment Among Youth under 25 years

In terms of unemployment among youth under 25 years, the demographic groups most similar to Nonimmigrants are Alsatian (11.9%, a difference of 0.020%), Immigrants from Middle Africa (11.9%, a difference of 0.11%), Yaqui (11.9%, a difference of 0.12%), Guamanian/Chamorro (11.9%, a difference of 0.13%), and Samoan (11.9%, a difference of 0.19%).
DemographicsRating | RankUnemployment Among Youth under 25 years
Colombians
9.1
/100
|
#212
Tragic
11.9%
South Americans
8.5
/100
|
#213
Tragic
11.9%
Costa Ricans
8.2
/100
|
#214
Tragic
11.9%
Samoans
7.4
/100
|
#215
Tragic
11.9%
Guamanians/Chamorros
7.0
/100
|
#216
Tragic
11.9%
Yaqui
6.9
/100
|
#217
Tragic
11.9%
Immigrants | Middle Africa
6.8
/100
|
#218
Tragic
11.9%
Immigrants | Nonimmigrants
6.2
/100
|
#219
Tragic
11.9%
Alsatians
6.1
/100
|
#220
Tragic
11.9%
Immigrants | Portugal
4.9
/100
|
#221
Tragic
12.0%
Israelis
4.1
/100
|
#222
Tragic
12.0%
Immigrants | Ireland
3.5
/100
|
#223
Tragic
12.0%
Hawaiians
3.5
/100
|
#224
Tragic
12.0%
Immigrants | Ukraine
3.0
/100
|
#225
Tragic
12.0%
Immigrants | Israel
2.6
/100
|
#226
Tragic
12.0%

Demographics Similar to Iranians by Unemployment Among Youth under 25 years

In terms of unemployment among youth under 25 years, the demographic groups most similar to Iranians are Immigrants from Norway (11.3%, a difference of 0.070%), Immigrants from Lithuania (11.3%, a difference of 0.14%), Immigrants from Kuwait (11.3%, a difference of 0.14%), Chilean (11.3%, a difference of 0.16%), and Immigrants from Jordan (11.3%, a difference of 0.18%).
DemographicsRating | RankUnemployment Among Youth under 25 years
Immigrants | Thailand
93.6
/100
|
#102
Exceptional
11.3%
Immigrants | Malaysia
93.6
/100
|
#103
Exceptional
11.3%
Immigrants | Afghanistan
93.4
/100
|
#104
Exceptional
11.3%
Immigrants | Jordan
93.1
/100
|
#105
Exceptional
11.3%
Chileans
93.0
/100
|
#106
Exceptional
11.3%
Immigrants | Lithuania
92.9
/100
|
#107
Exceptional
11.3%
Immigrants | Kuwait
92.9
/100
|
#108
Exceptional
11.3%
Iranians
92.0
/100
|
#109
Exceptional
11.3%
Immigrants | Norway
91.5
/100
|
#110
Exceptional
11.3%
Immigrants | France
90.3
/100
|
#111
Exceptional
11.3%
Immigrants | Austria
90.3
/100
|
#112
Exceptional
11.3%
Fijians
90.2
/100
|
#113
Exceptional
11.3%
Immigrants | Ethiopia
89.9
/100
|
#114
Excellent
11.3%
Immigrants | Vietnam
89.9
/100
|
#115
Excellent
11.3%
Burmese
89.8
/100
|
#116
Excellent
11.3%