Nepalese vs Immigrants from Mexico Unemployment Among Ages 55 to 59 years
COMPARE
Nepalese
Immigrants from Mexico
Unemployment Among Ages 55 to 59 years
Unemployment Among Ages 55 to 59 years Comparison
Nepalese
Immigrants from Mexico
5.6%
UNEMPLOYMENT AMONG AGES 55 TO 59 YEARS
0.0/ 100
METRIC RATING
309th/ 347
METRIC RANK
5.3%
UNEMPLOYMENT AMONG AGES 55 TO 59 YEARS
0.0/ 100
METRIC RATING
297th/ 347
METRIC RANK
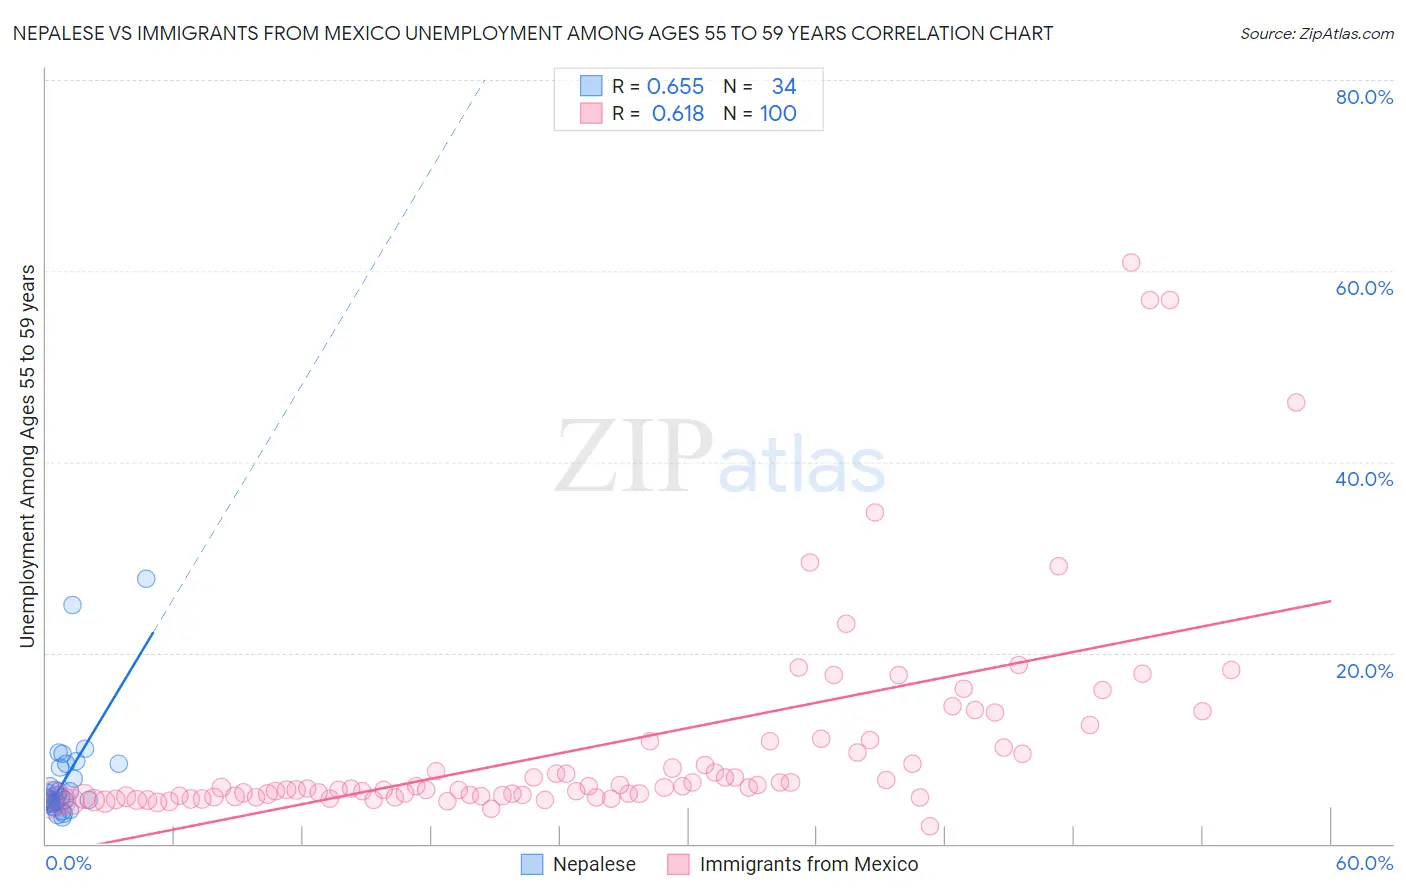
Nepalese vs Immigrants from Mexico Unemployment Among Ages 55 to 59 years Correlation Chart
The statistical analysis conducted on geographies consisting of 24,263,470 people shows a significant positive correlation between the proportion of Nepalese and unemployment rate among population between the ages 55 and 59 in the United States with a correlation coefficient (R) of 0.655 and weighted average of 5.6%. Similarly, the statistical analysis conducted on geographies consisting of 453,807,695 people shows a significant positive correlation between the proportion of Immigrants from Mexico and unemployment rate among population between the ages 55 and 59 in the United States with a correlation coefficient (R) of 0.618 and weighted average of 5.3%, a difference of 4.5%.
Unemployment Among Ages 55 to 59 years Correlation Summary
| Measurement | Nepalese | Immigrants from Mexico |
| Minimum | 2.7% | 1.8% |
| Maximum | 27.8% | 60.9% |
| Range | 25.1% | 59.1% |
| Mean | 6.7% | 10.1% |
| Median | 4.9% | 5.8% |
| Interquartile 25% (IQ1) | 4.2% | 4.9% |
| Interquartile 75% (IQ3) | 8.0% | 10.4% |
| Interquartile Range (IQR) | 3.8% | 5.5% |
| Standard Deviation (Sample) | 5.4% | 11.0% |
| Standard Deviation (Population) | 5.3% | 10.9% |
Demographics Similar to Nepalese and Immigrants from Mexico by Unemployment Among Ages 55 to 59 years
In terms of unemployment among ages 55 to 59 years, the demographic groups most similar to Nepalese are Belizean (5.6%, a difference of 0.44%), Spanish American Indian (5.6%, a difference of 0.58%), Houma (5.6%, a difference of 0.62%), Ecuadorian (5.6%, a difference of 0.84%), and Central American Indian (5.6%, a difference of 1.0%). Similarly, the demographic groups most similar to Immigrants from Mexico are Barbadian (5.3%, a difference of 0.22%), Dutch West Indian (5.3%, a difference of 0.26%), Cajun (5.3%, a difference of 0.38%), Hispanic or Latino (5.4%, a difference of 0.38%), and Immigrants from Grenada (5.3%, a difference of 0.50%).
| Demographics | Rating | Rank | Unemployment Among Ages 55 to 59 years |
| Immigrants | Grenada | 0.0 /100 | #293 | Tragic 5.3% |
| Cajuns | 0.0 /100 | #294 | Tragic 5.3% |
| Dutch West Indians | 0.0 /100 | #295 | Tragic 5.3% |
| Barbadians | 0.0 /100 | #296 | Tragic 5.3% |
| Immigrants | Mexico | 0.0 /100 | #297 | Tragic 5.3% |
| Hispanics or Latinos | 0.0 /100 | #298 | Tragic 5.4% |
| Cape Verdeans | 0.0 /100 | #299 | Tragic 5.4% |
| Immigrants | St. Vincent and the Grenadines | 0.0 /100 | #300 | Tragic 5.4% |
| Immigrants | Dominica | 0.0 /100 | #301 | Tragic 5.5% |
| Sierra Leoneans | 0.0 /100 | #302 | Tragic 5.5% |
| Marshallese | 0.0 /100 | #303 | Tragic 5.5% |
| Blacks/African Americans | 0.0 /100 | #304 | Tragic 5.5% |
| Immigrants | Portugal | 0.0 /100 | #305 | Tragic 5.5% |
| Immigrants | Cabo Verde | 0.0 /100 | #306 | Tragic 5.5% |
| Immigrants | Belize | 0.0 /100 | #307 | Tragic 5.5% |
| Spanish American Indians | 0.0 /100 | #308 | Tragic 5.6% |
| Nepalese | 0.0 /100 | #309 | Tragic 5.6% |
| Belizeans | 0.0 /100 | #310 | Tragic 5.6% |
| Houma | 0.0 /100 | #311 | Tragic 5.6% |
| Ecuadorians | 0.0 /100 | #312 | Tragic 5.6% |
| Central American Indians | 0.0 /100 | #313 | Tragic 5.6% |