Nepalese vs Immigrants from Eastern Asia Unemployment Among Ages 35 to 44 years
COMPARE
Nepalese
Immigrants from Eastern Asia
Unemployment Among Ages 35 to 44 years
Unemployment Among Ages 35 to 44 years Comparison
Nepalese
Immigrants from Eastern Asia
5.6%
UNEMPLOYMENT AMONG AGES 35 TO 44 YEARS
0.0/ 100
METRIC RATING
302nd/ 347
METRIC RANK
4.4%
UNEMPLOYMENT AMONG AGES 35 TO 44 YEARS
97.8/ 100
METRIC RATING
51st/ 347
METRIC RANK
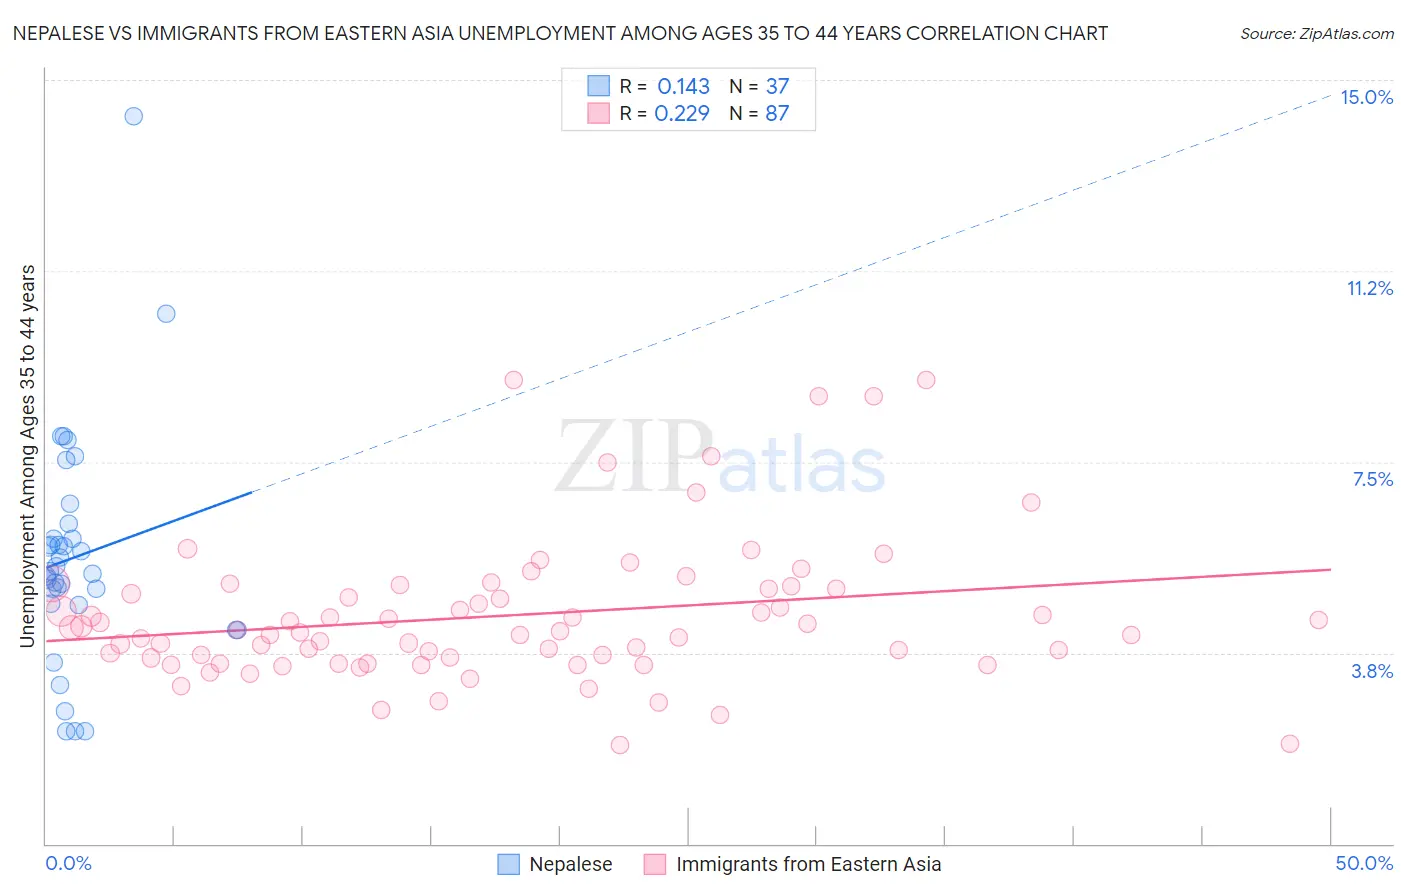
Nepalese vs Immigrants from Eastern Asia Unemployment Among Ages 35 to 44 years Correlation Chart
The statistical analysis conducted on geographies consisting of 24,495,494 people shows a poor positive correlation between the proportion of Nepalese and unemployment rate among population between the ages 35 and 44 in the United States with a correlation coefficient (R) of 0.143 and weighted average of 5.6%. Similarly, the statistical analysis conducted on geographies consisting of 481,023,005 people shows a weak positive correlation between the proportion of Immigrants from Eastern Asia and unemployment rate among population between the ages 35 and 44 in the United States with a correlation coefficient (R) of 0.229 and weighted average of 4.4%, a difference of 27.9%.
Unemployment Among Ages 35 to 44 years Correlation Summary
| Measurement | Nepalese | Immigrants from Eastern Asia |
| Minimum | 2.2% | 1.9% |
| Maximum | 14.3% | 9.1% |
| Range | 12.1% | 7.2% |
| Mean | 5.6% | 4.5% |
| Median | 5.3% | 4.2% |
| Interquartile 25% (IQ1) | 4.7% | 3.6% |
| Interquartile 75% (IQ3) | 6.1% | 5.0% |
| Interquartile Range (IQR) | 1.4% | 1.4% |
| Standard Deviation (Sample) | 2.3% | 1.4% |
| Standard Deviation (Population) | 2.2% | 1.4% |
Similar Demographics by Unemployment Among Ages 35 to 44 years
Demographics Similar to Nepalese by Unemployment Among Ages 35 to 44 years
In terms of unemployment among ages 35 to 44 years, the demographic groups most similar to Nepalese are African (5.6%, a difference of 0.13%), Immigrants from West Indies (5.6%, a difference of 0.17%), Immigrants from Jamaica (5.6%, a difference of 0.22%), Aleut (5.6%, a difference of 0.32%), and U.S. Virgin Islander (5.6%, a difference of 0.33%).
| Demographics | Rating | Rank | Unemployment Among Ages 35 to 44 years |
| Ottawa | 0.0 /100 | #295 | Tragic 5.6% |
| Immigrants | Trinidad and Tobago | 0.0 /100 | #296 | Tragic 5.6% |
| U.S. Virgin Islanders | 0.0 /100 | #297 | Tragic 5.6% |
| Aleuts | 0.0 /100 | #298 | Tragic 5.6% |
| Immigrants | Jamaica | 0.0 /100 | #299 | Tragic 5.6% |
| Immigrants | West Indies | 0.0 /100 | #300 | Tragic 5.6% |
| Africans | 0.0 /100 | #301 | Tragic 5.6% |
| Nepalese | 0.0 /100 | #302 | Tragic 5.6% |
| Yakama | 0.0 /100 | #303 | Tragic 5.6% |
| West Indians | 0.0 /100 | #304 | Tragic 5.7% |
| Belizeans | 0.0 /100 | #305 | Tragic 5.7% |
| Barbadians | 0.0 /100 | #306 | Tragic 5.7% |
| Immigrants | Belize | 0.0 /100 | #307 | Tragic 5.8% |
| Immigrants | Azores | 0.0 /100 | #308 | Tragic 5.8% |
| Immigrants | Barbados | 0.0 /100 | #309 | Tragic 5.8% |
Demographics Similar to Immigrants from Eastern Asia by Unemployment Among Ages 35 to 44 years
In terms of unemployment among ages 35 to 44 years, the demographic groups most similar to Immigrants from Eastern Asia are Immigrants from Turkey (4.4%, a difference of 0.020%), Okinawan (4.4%, a difference of 0.020%), Immigrants from Argentina (4.4%, a difference of 0.16%), Asian (4.4%, a difference of 0.32%), and Immigrants from Moldova (4.4%, a difference of 0.35%).
| Demographics | Rating | Rank | Unemployment Among Ages 35 to 44 years |
| Immigrants | Malaysia | 98.7 /100 | #44 | Exceptional 4.3% |
| Immigrants | Korea | 98.4 /100 | #45 | Exceptional 4.3% |
| Immigrants | Belgium | 98.4 /100 | #46 | Exceptional 4.3% |
| British | 98.3 /100 | #47 | Exceptional 4.4% |
| Bhutanese | 98.2 /100 | #48 | Exceptional 4.4% |
| Swiss | 98.2 /100 | #49 | Exceptional 4.4% |
| Immigrants | Turkey | 97.8 /100 | #50 | Exceptional 4.4% |
| Immigrants | Eastern Asia | 97.8 /100 | #51 | Exceptional 4.4% |
| Okinawans | 97.7 /100 | #52 | Exceptional 4.4% |
| Immigrants | Argentina | 97.6 /100 | #53 | Exceptional 4.4% |
| Asians | 97.4 /100 | #54 | Exceptional 4.4% |
| Immigrants | Moldova | 97.3 /100 | #55 | Exceptional 4.4% |
| Chileans | 97.3 /100 | #56 | Exceptional 4.4% |
| Immigrants | Hong Kong | 97.2 /100 | #57 | Exceptional 4.4% |
| English | 97.2 /100 | #58 | Exceptional 4.4% |