Navajo vs Cambodian Unemployment Among Women with Children Under 18 years
COMPARE
Navajo
Cambodian
Unemployment Among Women with Children Under 18 years
Unemployment Among Women with Children Under 18 years Comparison
Navajo
Cambodians
8.2%
UNEMPLOYMENT AMONG WOMEN WITH CHILDREN UNDER 18 YEARS
0.0/ 100
METRIC RATING
339th/ 347
METRIC RANK
4.8%
UNEMPLOYMENT AMONG WOMEN WITH CHILDREN UNDER 18 YEARS
99.9/ 100
METRIC RATING
14th/ 347
METRIC RANK
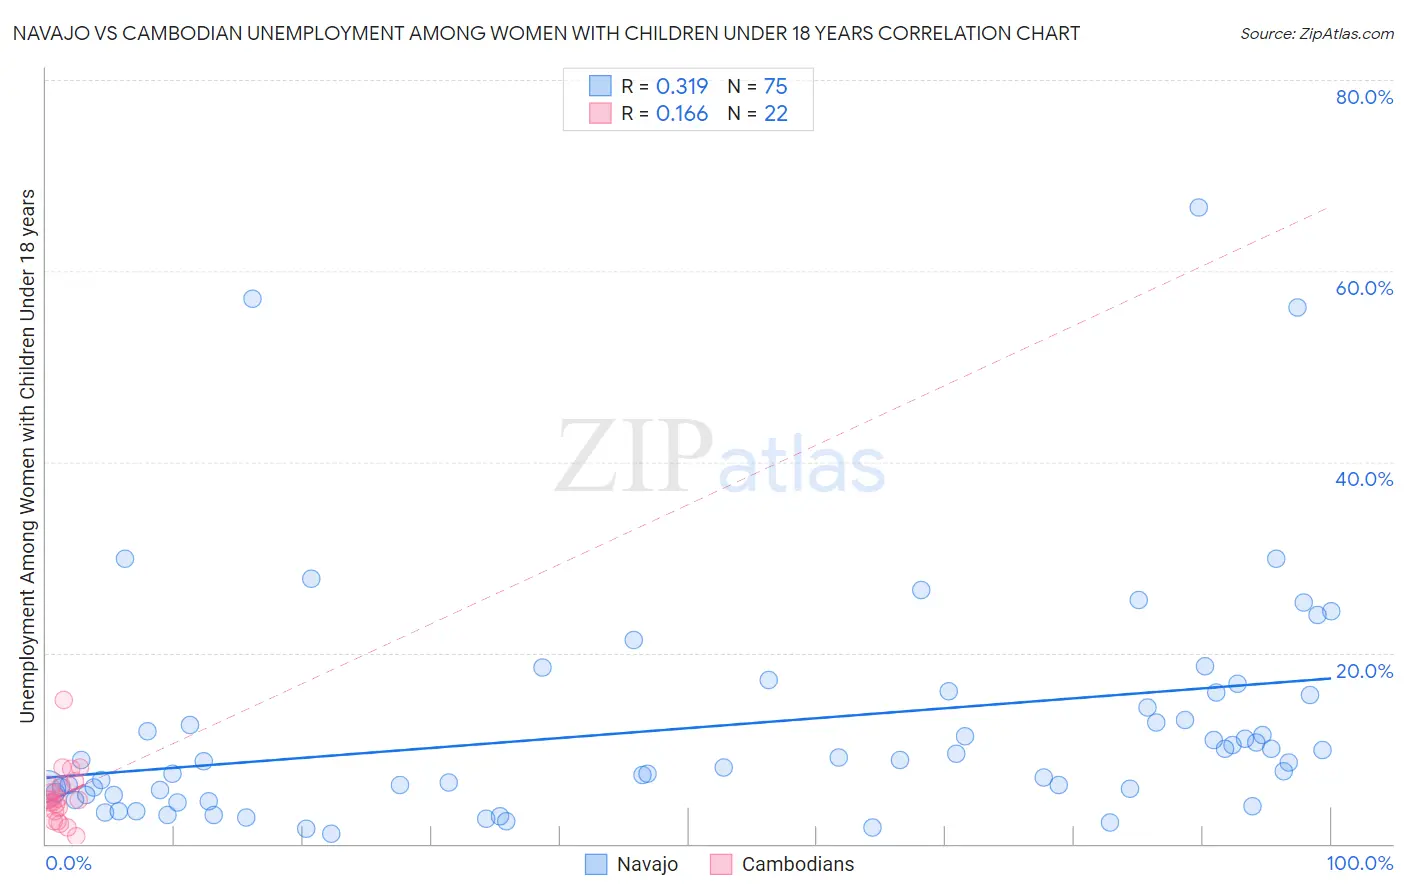
Navajo vs Cambodian Unemployment Among Women with Children Under 18 years Correlation Chart
The statistical analysis conducted on geographies consisting of 218,816,845 people shows a mild positive correlation between the proportion of Navajo and unemployment rate among women with children under the age of 18 in the United States with a correlation coefficient (R) of 0.319 and weighted average of 8.2%. Similarly, the statistical analysis conducted on geographies consisting of 101,414,720 people shows a poor positive correlation between the proportion of Cambodians and unemployment rate among women with children under the age of 18 in the United States with a correlation coefficient (R) of 0.166 and weighted average of 4.8%, a difference of 70.9%.
Unemployment Among Women with Children Under 18 years Correlation Summary
| Measurement | Navajo | Cambodian |
| Minimum | 1.1% | 0.75% |
| Maximum | 66.7% | 15.1% |
| Range | 65.6% | 14.3% |
| Mean | 12.2% | 5.0% |
| Median | 8.7% | 4.6% |
| Interquartile 25% (IQ1) | 5.2% | 3.4% |
| Interquartile 75% (IQ3) | 15.6% | 6.2% |
| Interquartile Range (IQR) | 10.4% | 2.8% |
| Standard Deviation (Sample) | 12.3% | 3.0% |
| Standard Deviation (Population) | 12.2% | 2.9% |
Similar Demographics by Unemployment Among Women with Children Under 18 years
Demographics Similar to Navajo by Unemployment Among Women with Children Under 18 years
In terms of unemployment among women with children under 18 years, the demographic groups most similar to Navajo are Crow (8.2%, a difference of 0.20%), Immigrants from Yemen (8.2%, a difference of 0.52%), Yakama (8.1%, a difference of 2.1%), Sioux (7.9%, a difference of 3.6%), and Apache (7.9%, a difference of 3.9%).
| Demographics | Rating | Rank | Unemployment Among Women with Children Under 18 years |
| Dominicans | 0.0 /100 | #332 | Tragic 7.5% |
| Immigrants | Dominican Republic | 0.0 /100 | #333 | Tragic 7.5% |
| Cheyenne | 0.0 /100 | #334 | Tragic 7.8% |
| Apache | 0.0 /100 | #335 | Tragic 7.9% |
| Sioux | 0.0 /100 | #336 | Tragic 7.9% |
| Yakama | 0.0 /100 | #337 | Tragic 8.1% |
| Immigrants | Yemen | 0.0 /100 | #338 | Tragic 8.2% |
| Navajo | 0.0 /100 | #339 | Tragic 8.2% |
| Crow | 0.0 /100 | #340 | Tragic 8.2% |
| Tohono O'odham | 0.0 /100 | #341 | Tragic 8.9% |
| Puerto Ricans | 0.0 /100 | #342 | Tragic 9.0% |
| Arapaho | 0.0 /100 | #343 | Tragic 9.2% |
| Inupiat | 0.0 /100 | #344 | Tragic 9.6% |
| Yuman | 0.0 /100 | #345 | Tragic 9.8% |
| Yup'ik | 0.0 /100 | #346 | Tragic 11.0% |
Demographics Similar to Cambodians by Unemployment Among Women with Children Under 18 years
In terms of unemployment among women with children under 18 years, the demographic groups most similar to Cambodians are Thai (4.8%, a difference of 0.16%), Bulgarian (4.8%, a difference of 0.35%), Taiwanese (4.8%, a difference of 0.62%), Immigrants from Singapore (4.9%, a difference of 0.82%), and Scandinavian (4.8%, a difference of 0.86%).
| Demographics | Rating | Rank | Unemployment Among Women with Children Under 18 years |
| Immigrants | India | 100.0 /100 | #7 | Exceptional 4.7% |
| Immigrants | Hong Kong | 100.0 /100 | #8 | Exceptional 4.7% |
| Okinawans | 99.9 /100 | #9 | Exceptional 4.7% |
| Czechs | 99.9 /100 | #10 | Exceptional 4.7% |
| Filipinos | 99.9 /100 | #11 | Exceptional 4.8% |
| Scandinavians | 99.9 /100 | #12 | Exceptional 4.8% |
| Bulgarians | 99.9 /100 | #13 | Exceptional 4.8% |
| Cambodians | 99.9 /100 | #14 | Exceptional 4.8% |
| Thais | 99.8 /100 | #15 | Exceptional 4.8% |
| Taiwanese | 99.8 /100 | #16 | Exceptional 4.8% |
| Immigrants | Singapore | 99.8 /100 | #17 | Exceptional 4.9% |
| Slovenes | 99.8 /100 | #18 | Exceptional 4.9% |
| Germans | 99.8 /100 | #19 | Exceptional 4.9% |
| Latvians | 99.7 /100 | #20 | Exceptional 4.9% |
| Europeans | 99.6 /100 | #21 | Exceptional 4.9% |