Mongolian vs Tsimshian Unemployment Among Ages 16 to 19 years
COMPARE
Mongolian
Tsimshian
Unemployment Among Ages 16 to 19 years
Unemployment Among Ages 16 to 19 years Comparison
Mongolians
Tsimshian
16.9%
UNEMPLOYMENT AMONG AGES 16 TO 19 YEARS
95.6/ 100
METRIC RATING
95th/ 347
METRIC RANK
17.3%
UNEMPLOYMENT AMONG AGES 16 TO 19 YEARS
76.0/ 100
METRIC RATING
147th/ 347
METRIC RANK
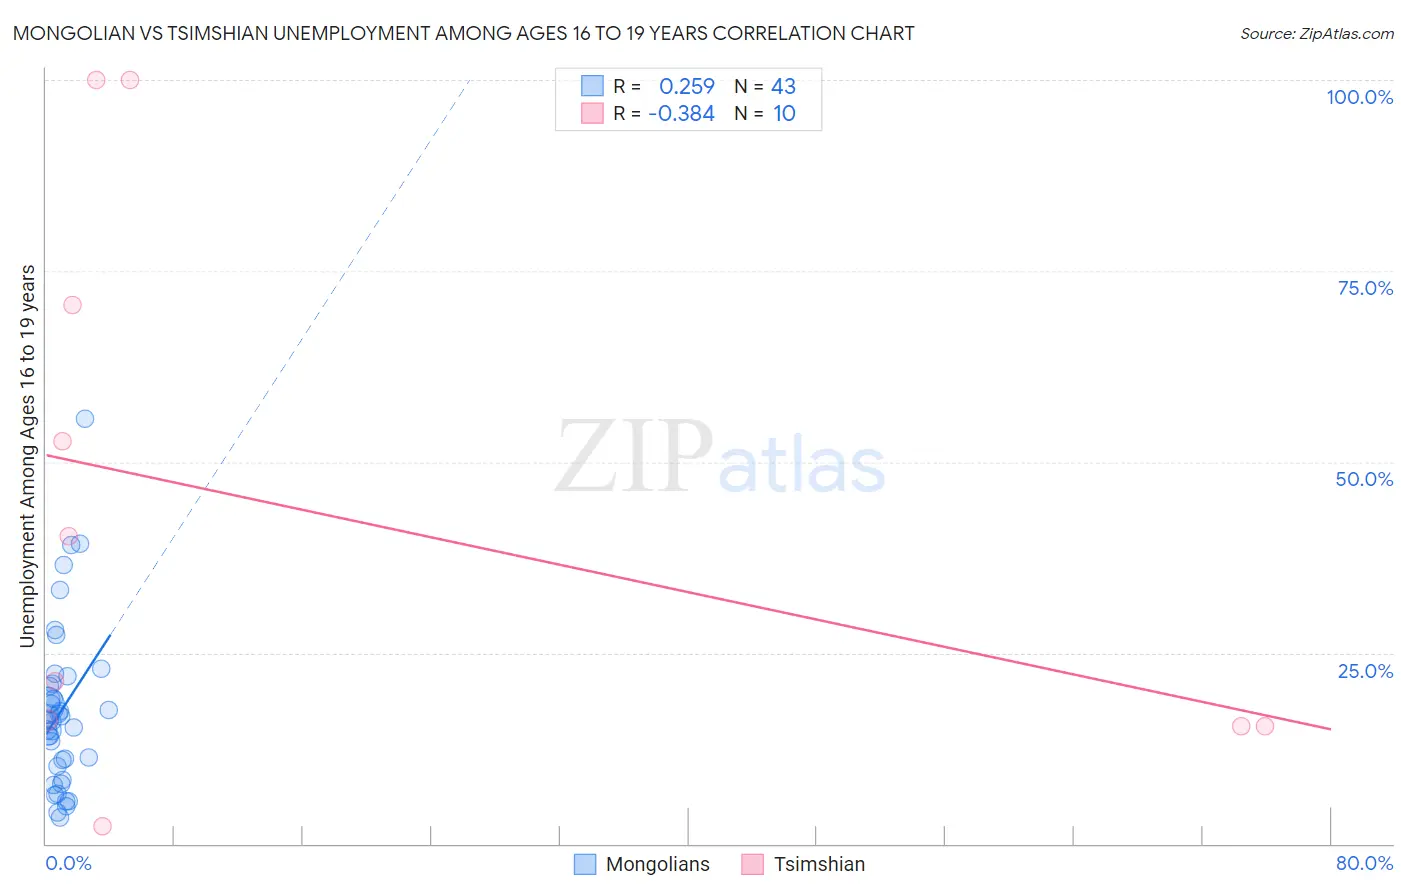
Mongolian vs Tsimshian Unemployment Among Ages 16 to 19 years Correlation Chart
The statistical analysis conducted on geographies consisting of 137,919,207 people shows a weak positive correlation between the proportion of Mongolians and unemployment rate among population between the ages 16 and 19 in the United States with a correlation coefficient (R) of 0.259 and weighted average of 16.9%. Similarly, the statistical analysis conducted on geographies consisting of 15,537,445 people shows a mild negative correlation between the proportion of Tsimshian and unemployment rate among population between the ages 16 and 19 in the United States with a correlation coefficient (R) of -0.384 and weighted average of 17.3%, a difference of 2.3%.
Unemployment Among Ages 16 to 19 years Correlation Summary
| Measurement | Mongolian | Tsimshian |
| Minimum | 3.5% | 2.3% |
| Maximum | 55.6% | 100.0% |
| Range | 52.1% | 97.7% |
| Mean | 17.4% | 43.4% |
| Median | 16.1% | 30.8% |
| Interquartile 25% (IQ1) | 10.1% | 15.4% |
| Interquartile 75% (IQ3) | 21.0% | 70.6% |
| Interquartile Range (IQR) | 10.9% | 55.2% |
| Standard Deviation (Sample) | 10.8% | 36.1% |
| Standard Deviation (Population) | 10.7% | 34.2% |
Similar Demographics by Unemployment Among Ages 16 to 19 years
Demographics Similar to Mongolians by Unemployment Among Ages 16 to 19 years
In terms of unemployment among ages 16 to 19 years, the demographic groups most similar to Mongolians are Ottawa (16.9%, a difference of 0.040%), Immigrants from Venezuela (16.9%, a difference of 0.060%), Bangladeshi (16.9%, a difference of 0.070%), Cuban (16.9%, a difference of 0.080%), and South African (16.9%, a difference of 0.12%).
| Demographics | Rating | Rank | Unemployment Among Ages 16 to 19 years |
| Immigrants | South Africa | 96.9 /100 | #88 | Exceptional 16.9% |
| Canadians | 96.7 /100 | #89 | Exceptional 16.9% |
| Asians | 96.6 /100 | #90 | Exceptional 16.9% |
| Cambodians | 96.3 /100 | #91 | Exceptional 16.9% |
| South Africans | 95.9 /100 | #92 | Exceptional 16.9% |
| Cubans | 95.8 /100 | #93 | Exceptional 16.9% |
| Bangladeshis | 95.8 /100 | #94 | Exceptional 16.9% |
| Mongolians | 95.6 /100 | #95 | Exceptional 16.9% |
| Ottawa | 95.4 /100 | #96 | Exceptional 16.9% |
| Immigrants | Venezuela | 95.3 /100 | #97 | Exceptional 16.9% |
| Burmese | 95.0 /100 | #98 | Exceptional 17.0% |
| Immigrants | Lithuania | 94.9 /100 | #99 | Exceptional 17.0% |
| Immigrants | Thailand | 94.7 /100 | #100 | Exceptional 17.0% |
| Immigrants | Saudi Arabia | 94.7 /100 | #101 | Exceptional 17.0% |
| Immigrants | Pakistan | 94.6 /100 | #102 | Exceptional 17.0% |
Demographics Similar to Tsimshian by Unemployment Among Ages 16 to 19 years
In terms of unemployment among ages 16 to 19 years, the demographic groups most similar to Tsimshian are Turkish (17.3%, a difference of 0.070%), Romanian (17.3%, a difference of 0.070%), Indian (Asian) (17.3%, a difference of 0.11%), Immigrants from Eastern Asia (17.4%, a difference of 0.14%), and Immigrants from England (17.3%, a difference of 0.20%).
| Demographics | Rating | Rank | Unemployment Among Ages 16 to 19 years |
| Immigrants | Croatia | 80.8 /100 | #140 | Excellent 17.3% |
| Basques | 80.7 /100 | #141 | Excellent 17.3% |
| Spanish | 79.3 /100 | #142 | Good 17.3% |
| Immigrants | Egypt | 79.1 /100 | #143 | Good 17.3% |
| Immigrants | England | 78.9 /100 | #144 | Good 17.3% |
| Indians (Asian) | 77.6 /100 | #145 | Good 17.3% |
| Turks | 77.1 /100 | #146 | Good 17.3% |
| Tsimshian | 76.0 /100 | #147 | Good 17.3% |
| Romanians | 74.9 /100 | #148 | Good 17.3% |
| Immigrants | Eastern Asia | 73.8 /100 | #149 | Good 17.4% |
| Immigrants | Northern Europe | 72.5 /100 | #150 | Good 17.4% |
| Immigrants | Hong Kong | 69.3 /100 | #151 | Good 17.4% |
| Immigrants | Northern Africa | 69.0 /100 | #152 | Good 17.4% |
| Immigrants | Afghanistan | 68.6 /100 | #153 | Good 17.4% |
| Afghans | 68.1 /100 | #154 | Good 17.4% |